Ethereum price struggled to recover above $3,350 and corrected gains. ETH is consolidating near $3,200 and facing many hurdles.
- Ethereum started another decline and tested the $3,120 zone.
- The price is trading below $3,220 and the 100-hourly Simple Moving Average.
- There is a short-term rising channel forming with support at $3,170 on the hourly chart of ETH/USD (data feed via Kraken).
- The pair could continue to move down if it trades below the $3,170 support.
Ethereum Price Faces Uphill Task
Ethereum price failed to settle above the $3,250 level and started another decline, like Bitcoin. ETH traded below the $3,200 level and even spiked below $3,120. A low was formed at $3,113 and the price is now consolidating.
There was a minor increase above the $3,200 level. The price broke the 23.6% Fib retracement level of the recent decline from the $3,355 swing high to the $3,113 low. However, the bears were active near the $3,240 and $3,250 levels.
The 50% Fib retracement level of the recent decline from the $3,355 swing high to the $3,113 low acted as a hurdle. There was a fresh decline below the $3,200 level. Ethereum is now trading below $3,200 and the 100-hourly Simple Moving Average.
There is also a short-term rising channel forming with support at $3,170 on the hourly chart of ETH/USD. Immediate resistance is near the $3,200 level and the 100-hourly Simple Moving Average.
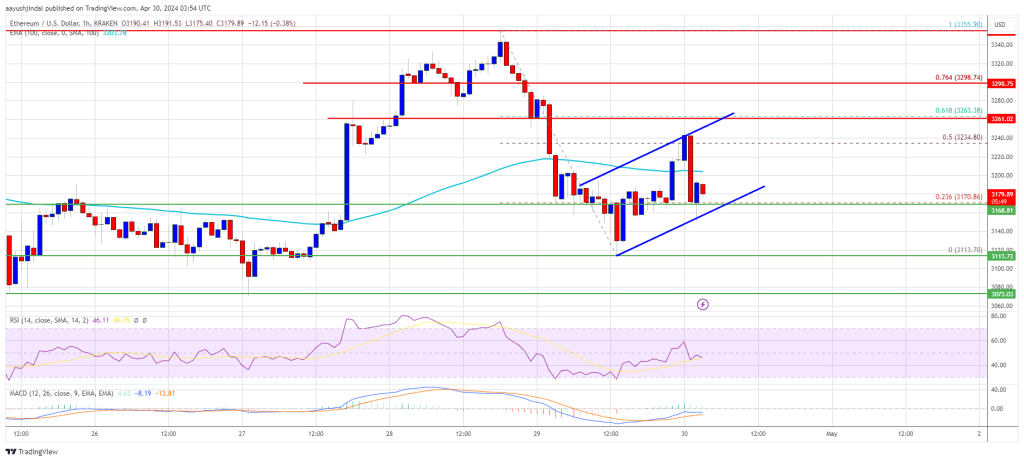
Source: ETHUSD on TradingView.com
The first major resistance is near the $3,240 level. The next key resistance sits at $3,300, above which the price might gain traction and rise toward the $3,350 level. A close above the $3,350 resistance could send the price toward the $3,450 resistance. If there is a move above the $3,450 resistance, Ethereum could even test the $3,550 resistance. Any more gains could send Ether toward the $3,620 resistance zone.
More Downsides In ETH?
If Ethereum fails to clear the $3,250 resistance, it could continue to move down. Initial support on the downside is near the $3,170 level and the channel zone. The first major support is near the $3,120 zone.
The main support is near the $3,070 level. A clear move below the $3,070 support might push the price toward $3,030. Any more losses might send the price toward the $2,880 level in the near term.
Technical Indicators
Hourly MACD – The MACD for ETH/USD is gaining momentum in the bearish zone.
Hourly RSI – The RSI for ETH/USD is now below the 50 level.
Major Support Level – $3,170
Major Resistance Level – $3,250


