Ethereum has bounced back sharply, reclaiming the $2,400 level after a volatile week marked by geopolitical tensions in the Middle East. Last weekend, ETH briefly dipped below the $2,200 mark as panic selling swept across global markets following US attacks on Iranian nuclear facilities. The sell-off triggered a sharp fakeout that briefly pushed ETH out of its multi-week trading range. However, bulls are regaining control, and Ethereum’s price action now signals the early stages of a potential recovery rally.
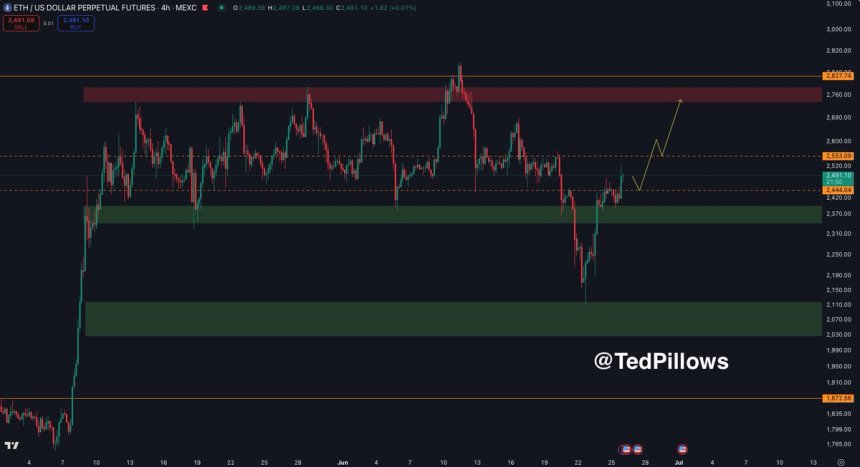
Top analyst Ted Pillows shared a technical analysis highlighting that Ethereum is reclaiming the key $2,444 resistance level — a zone that previously acted as both support and resistance throughout May and June. If bulls maintain momentum above this threshold, it could open the door for a bullish continuation toward the higher end of the established range.
While uncertainty remains due to lingering macroeconomic and geopolitical risks, Ethereum’s current structure shows renewed strength. Market participants are watching closely, as ETH often serves as a leading indicator for broader altcoin performance. Holding above $2,400 could become a catalyst for a broader rally, especially if Bitcoin continues to stabilize and approach new all-time highs.
Ethereum Battles For Breakout As Market Awaits Direction
Ethereum is trading at a critical juncture after a turbulent week of price action driven by geopolitical instability and macroeconomic uncertainty. Following a sharp drop below $2,200 amid panic selling over the Middle East conflict escalation, ETH has recovered significantly, now hovering around the $2,444 level. This price zone is key, not only as a technical resistance but also as a sentiment marker for traders watching for signs of a trend reversal or confirmation of a deeper pullback.
Analysts remain divided on what comes next. Some believe Ethereum’s recent recovery could signal the beginning of a bullish continuation, especially if price action holds and pushes above the upper range levels near $2,600. A breakout from this zone would indicate renewed strength and could set the tone for a broader altcoin rally, particularly as Ethereum often leads sector momentum. Others, however, warn that the recovery might be short-lived, and a retreat to lower demand zones could occur if macro conditions worsen.
Ted Pillows notes that Ethereum is currently reclaiming the $2,444 resistance level. He emphasizes that bullish continuation into the range highs is necessary to confirm breakout strength. Until then, traders are watching closely, as any rejection at this level could shift momentum back to the downside. With global tensions and monetary tightening from central banks continuing to influence markets, the coming weeks may determine whether ETH enters a new uptrend or retreats further into its long-standing consolidation range.
ETH Faces Long-Term Resistance
The weekly chart of Ethereum (ETH/USD) shows a strong recovery from the $2,189 low, with ETH currently trading at $2,463 — a 10.5% gain so far this week. This sharp bounce comes after a fakeout below the $2,200 level and suggests renewed buying pressure following recent geopolitical volatility. However, price is now testing a major confluence zone formed by the 50-week ($2,660), 100-week ($2,625), and 200-week ($2,437) simple moving averages.
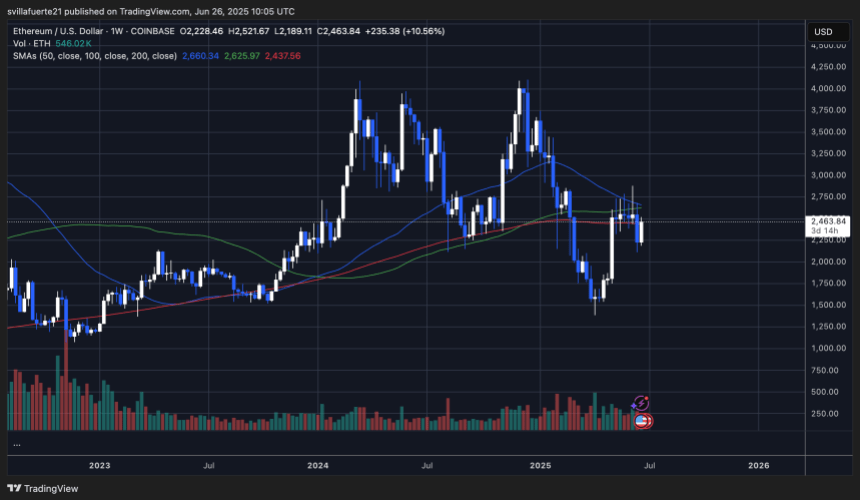
This cluster of moving averages is acting as resistance, capping ETH’s upside momentum. Historically, when Ethereum breaks through these long-term trend lines, a significant trend continuation follows. But for now, bulls must decisively clear this $2,450–$2,660 zone to confirm a breakout and open the door toward the $3,000 psychological level.
Volume has slightly increased, indicating rising interest, but the rejection wicks from prior weekly candles suggest the market remains indecisive. As long as ETH holds above the 200-week SMA ($2,437), the structure remains constructive, but a breakdown below it would likely reintroduce bearish sentiment.
Featured image from Dall-E, chart from TradingView


