Ethereum price started a fresh decline from $3,480. ETH is struggling to recover and is now at risk of another decline below $3,250.
- Ethereum started another bearish wave after it settled below $3,450.
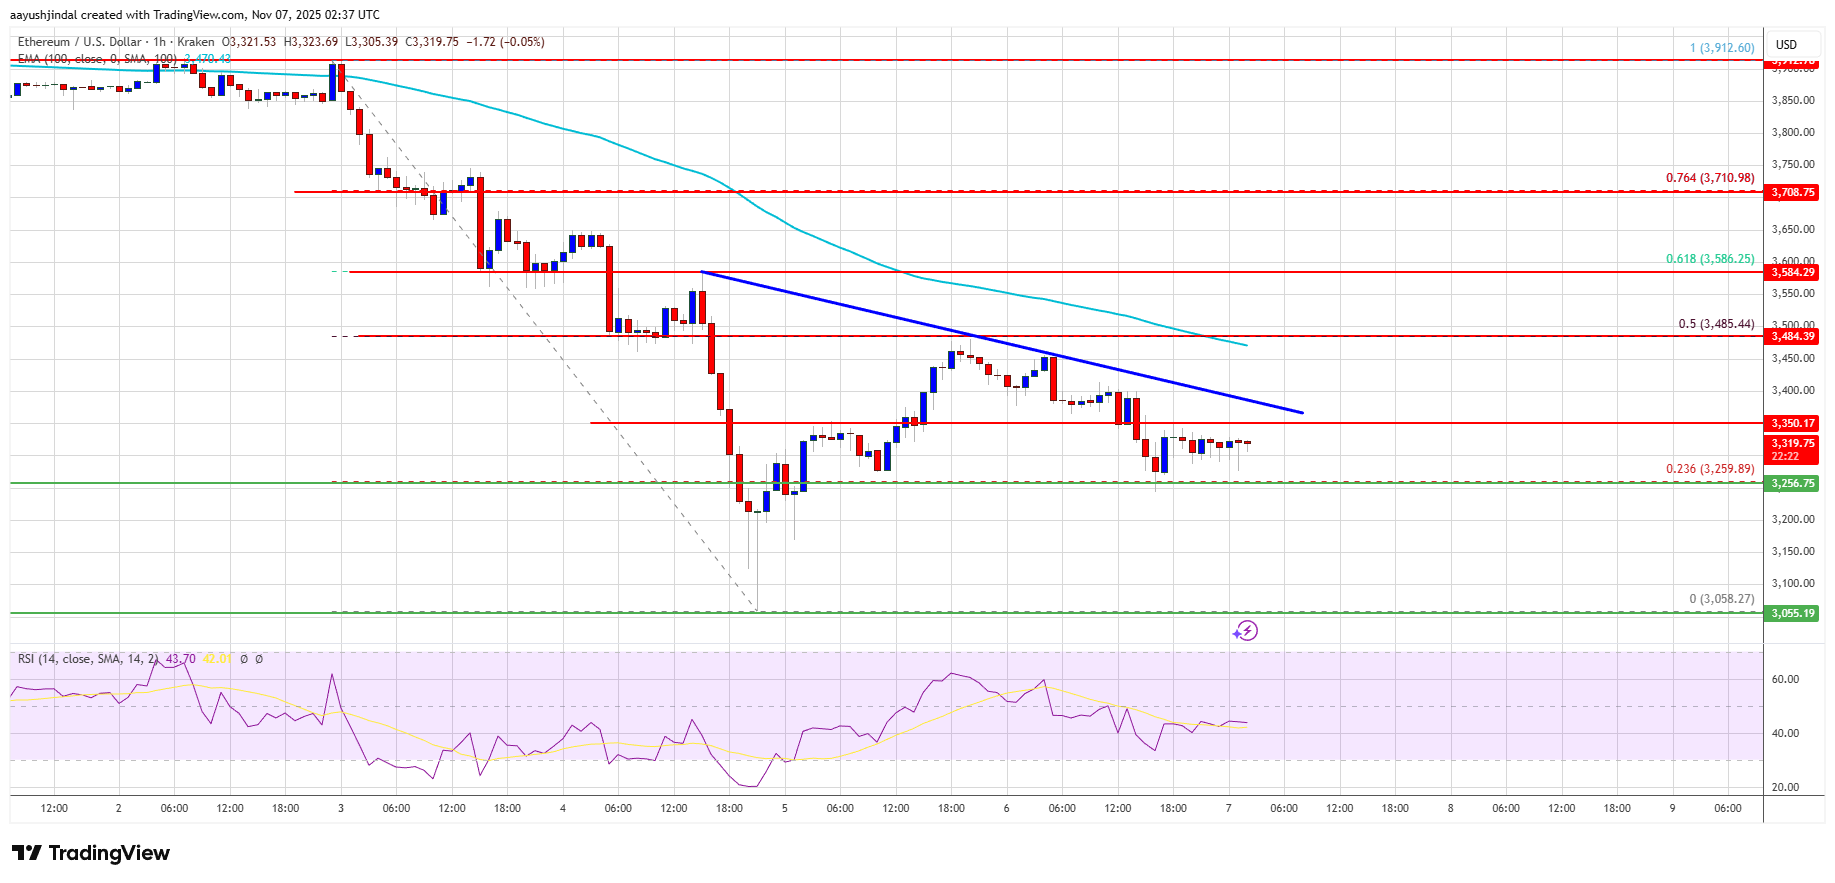
- The price is trading below $3,400 and the 100-hourly Simple Moving Average.
- There is a new bearish trend line forming with resistance at $3,380 on the hourly chart of ETH/USD (data feed via Kraken).
- The pair could continue to move down if it trades below $3,250.
Ethereum Price Dips Again
Ethereum price failed to stay in a positive zone and started a fresh decline from $3,480, like Bitcoin. ETH price declined below $3,420 and $3,400.
It seems like the bears defended the 50% Fib retracement level of the downward move from the $3,920 swing high to the $3,058 low. There is also a new bearish trend line forming with resistance at $3,380 on the hourly chart of ETH/USD.
Ethereum price is now trading below $3,350 and the 100-hourly Simple Moving Average. If there is another recovery wave, the price could face resistance near the $3,350 level. The next key resistance is near the $3,380 level and the trend line.
The first major resistance is near the $3,480 level. A clear move above the $3,480 resistance might send the price toward the $3,580 resistance and the 61.8% Fib retracement level of the downward move from the $3,920 swing high to the $3,058 low.
An upside break above the $3,580 region might call for more gains in the coming days. In the stated case, Ether could rise toward the $3,650 resistance zone or even $3,675 in the near term.
Another Decline In ETH?
If Ethereum fails to clear the $3,380 resistance, it could start a fresh decline. Initial support on the downside is near the $3,250 level. The first major support sits near the $3,220 zone.
A clear move below the $3,220 support might push the price toward the $3,150 support. Any more losses might send the price toward the $3,050 region in the near term. The next key support sits at $3,020 and $3,000.
Technical Indicators
Hourly MACD – The MACD for ETH/USD is gaining momentum in the bearish zone.
Hourly RSI – The RSI for ETH/USD is now below the 50 zone.
Major Support Level – $3,250
Major Resistance Level – $3,380


