An analyst has explained what some charts related to Bitcoin could say regarding whether the current run can lead to a new high or not.
Bitcoin Momentum May Be Stalling According To These Signs
In a new post on X, analyst Ali Martinez has talked about some technical analysis (TA) signs that could reveal if it’s time for Bitcoin to reach a new all-time high (ATH).
Here are the charts that the analyst has shared:
The first graph shows a TA pattern that Bitcoin has potentially been trading inside for the last few months. The pattern in question is a “Parallel Channel,” which emerges whenever an asset’s price observes consolidation between two parallel trendlines.
There are different types of Parallel Channels, but in the context of the current topic, the most ordinary version is of interest: the one with the channel parallel to the time-axis. This case naturally corresponds to a completely sideways movement from the cryptocurrency.
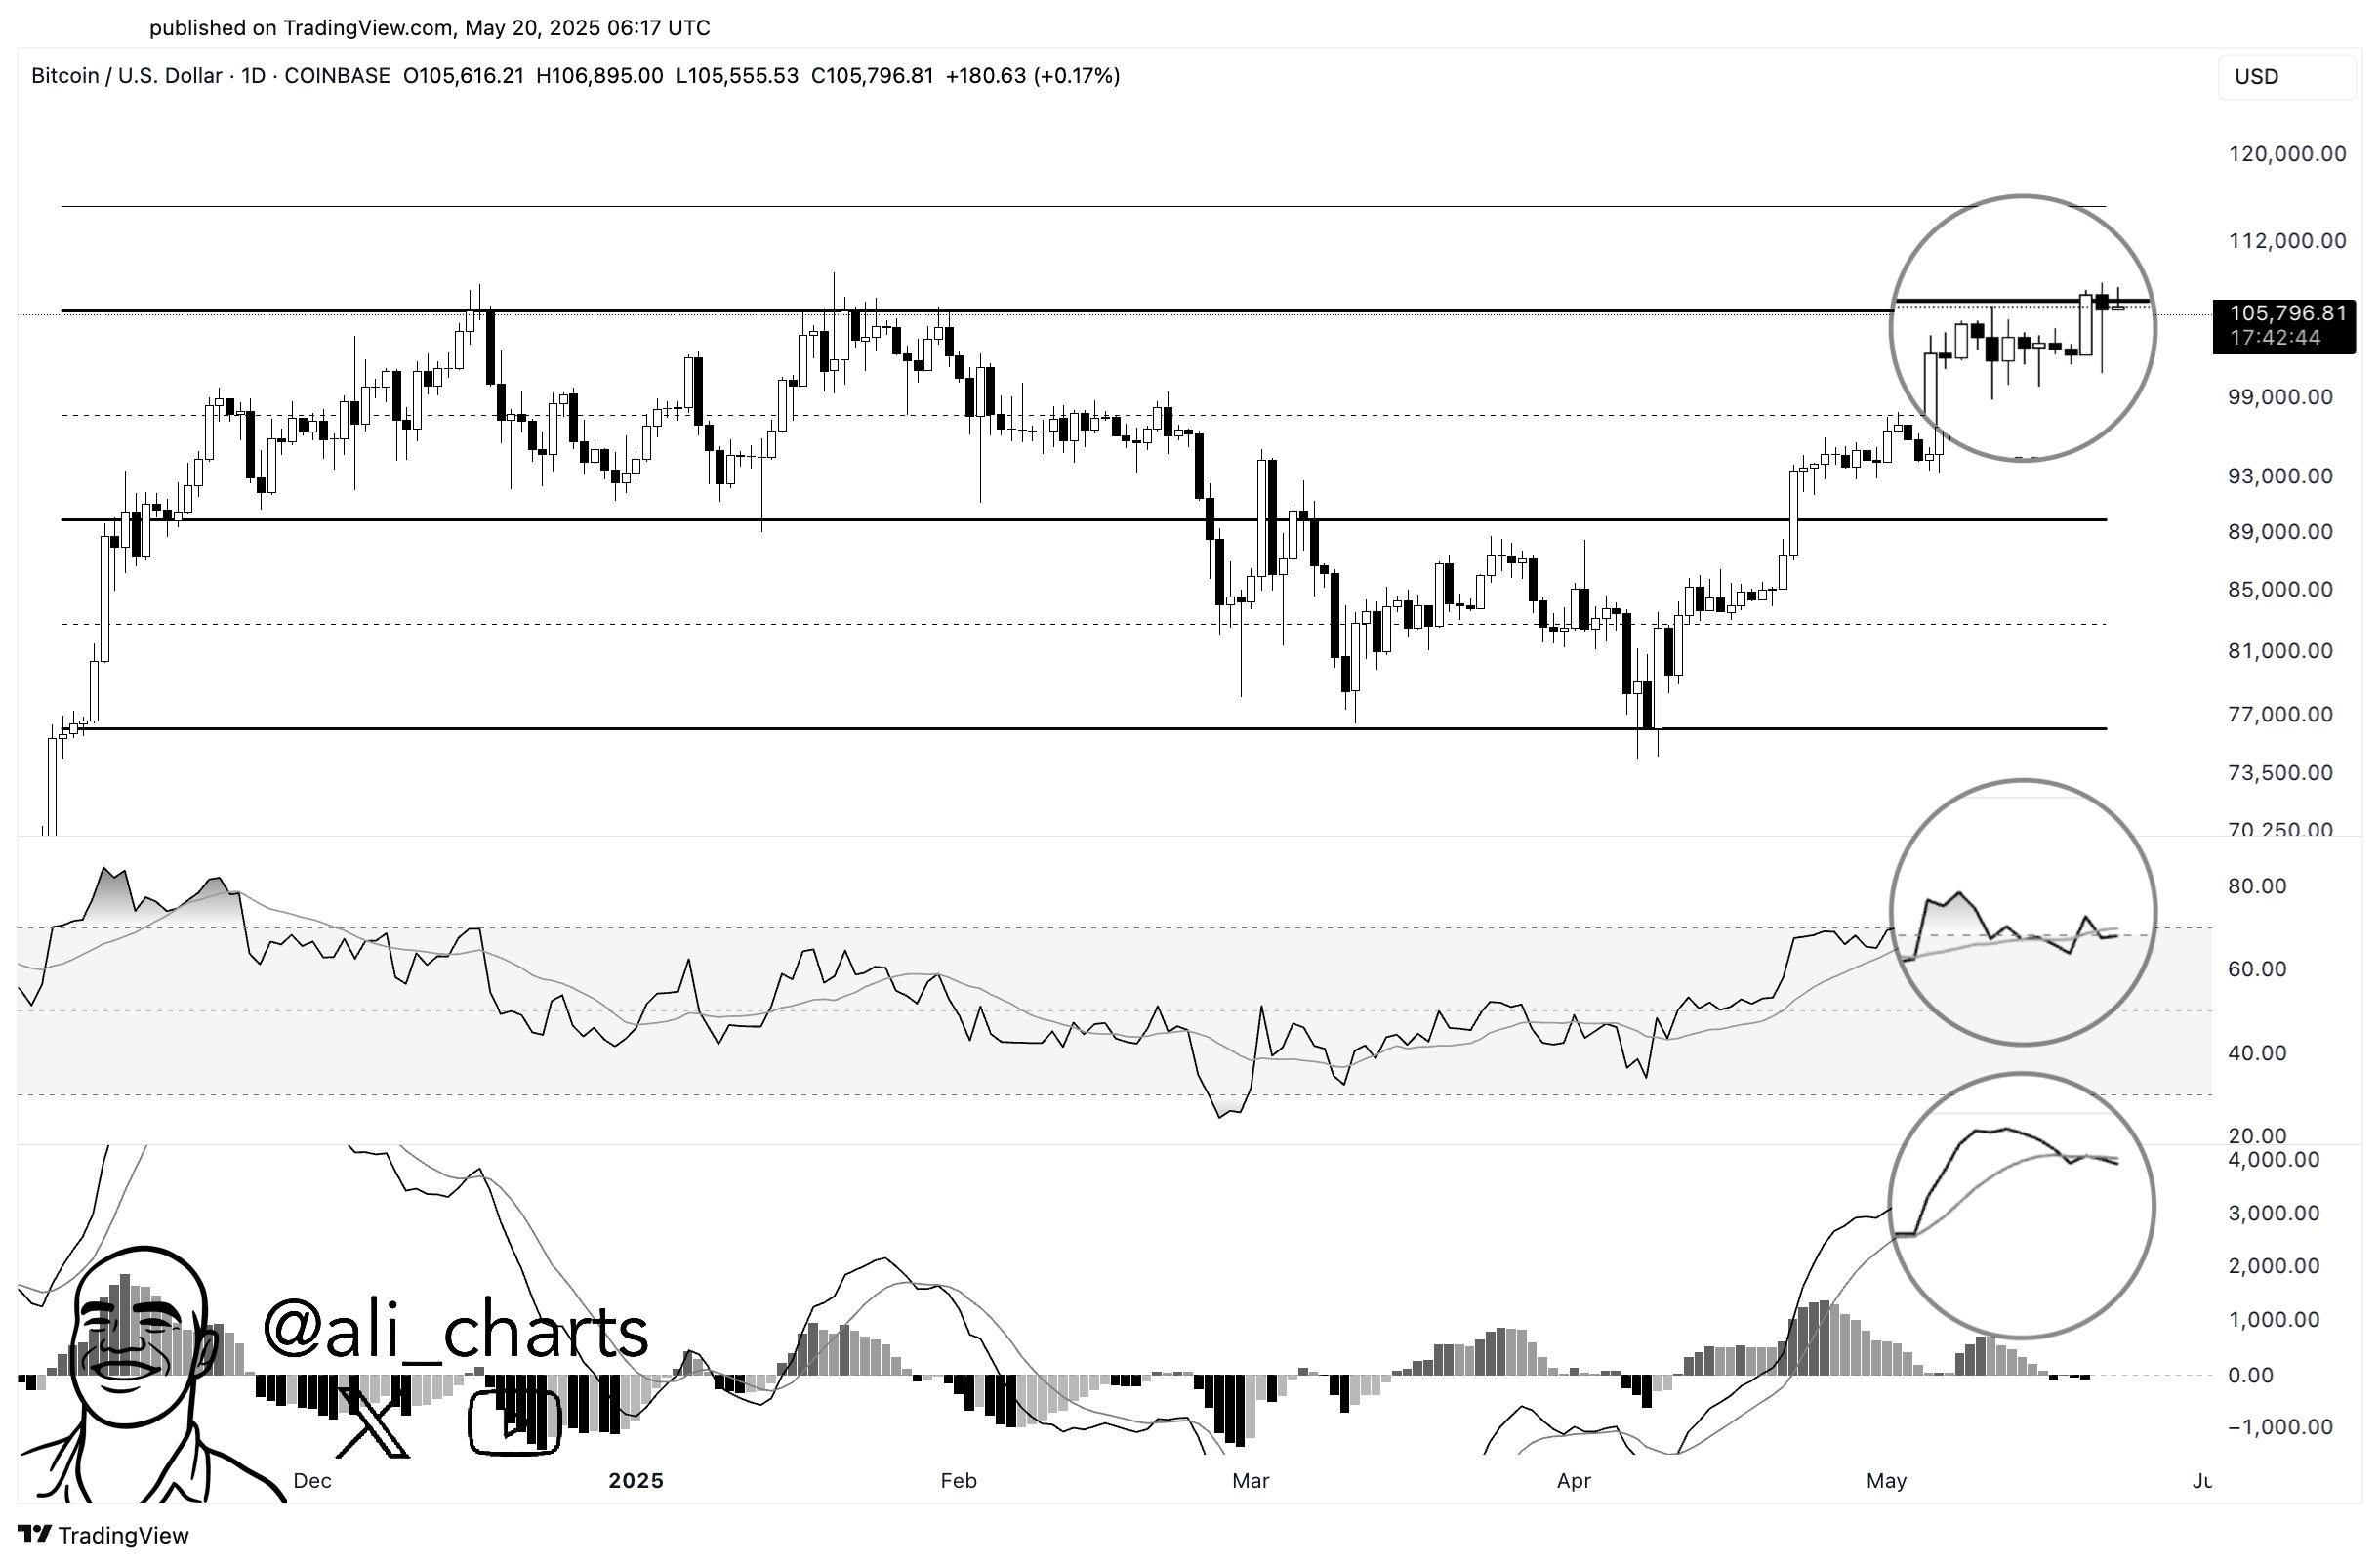
From the chart, it’s visible that BTC has recently observed a rise to the upper line of the pattern. During previous retests, the coin ended up finding rejection at this mark. Thus, it’s possible that it may also face resistance here during the current retest.
This isn’t the only trend that could make a break to the ATH a tricky one. As is visible from the second graph, the RSI has shown divergence from the Bitcoin price recently. The Relative Strength Index (RSI) here refers to an indicator that keeps track of the speed and magnitude of changes that the asset’s price has witnessed recently. This metric is generally used for judging overpriced and underpriced conditions for the token.
BTC’s RSI formed a peak in the overbought region earlier in the month, but while the price has gone up since then, the indicator has only managed to form a smaller peak. This type of divergence between the asset and the RSI is often considered to be a bearish signal.
Lastly, there is also a bearish development in the MACD, displayed in the third chart. The Moving Average Convergence/Divergence (MACD) is another TA indicator that’s used for gauging momentum.
It involves two lines: the MACD line calculated by taking the difference between the 12-day and 26-day exponential moving averages (EMAs) of the price and the signal line determined as the 9-day EMA of the MACD line. Recently, the MACD line for Bitcoin has dipped under the signal line, which is usually considered as a bearish crossover.
Based on all these patterns, Martinez has noted that momentum is stalling for BTC. It now remains to be seen how the asset would develop in the coming days and if a reversal to the downside would happen.
BTC Price
Following another attempt at a sustainable break beyond $106,000, Bitcoin has seen a pullback to the $105,300 level.


