The Ethereum price action is showing remarkable similarities to its 2017 market cycle, with analysts pointing to a near-identical technical setup and market behaviour. Crypto analyst Merlijn the Trader, who shared a side-by-side weekly chart comparison of 2025 and 2017 on X (formerly Twitter), suggests that Ethereum is now following the same breakout pattern that once led to a historic rally. This time, however, the analyst believes that the move could be even more significant.
Ethereum Price Mirrors Historic Breakout Pattern
In the current 2025 chart, Ethereum has reportedly claimed the 50-week Moving Average (MA) after months of downward pressure and range-bound movement. Following a decisive breakout from support levels near $2,250, the price of the cryptocurrency is now consolidating below the 50 MA, forming a tight sideways pattern.
According to Merlijn the Trader, this structure is visually and technically similar to price movements that occurred in late 2016 and early 2017, just before Ethereum began a powerful upward surge. The analyst’s 2017 Ethereum chart shows the altcoin breaking above the 50 MA, followed by a brief period of sideways action under resistance. Once momentum was built, the price launched into a parabolic rally that marked the beginning of its major bull cycle.
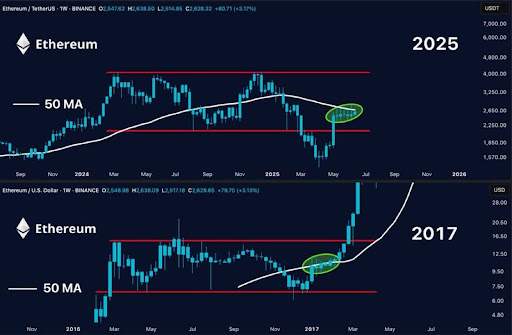
Notably, the 2025 chart situated on the right panel displays an almost identical playbook to the 2017 setup, with Ethereum moving out of a prolonged accumulation phase and into a zone of consolidation beneath key resistance levels. However, this time, market conditions are significantly different.
The analyst notes that the crypto space is far more developed, with increased institutional involvement, broader retail adoption, and growing infrastructure supporting Ethereum’s ecosystem. While the technical patterns align closely with the 2017 breakout, the scale and context suggest that the potential upside could even be greater.
The similarities between Ethereum’s 2017 and 2025 price action lie in the timing of the 50 MA reclaim and the tight range of consolidation that follows. If ETH can maintain this trajectory and break above the current resistance zone, it could mark the beginning of a fresh macro rally, which the analyst predicts will not just repeat history but possibly amplify it.
Ethereum Eyes $4,000 As 2017 Pattern Repeats
Based on Merlijn The Trader’s comparable chart analysis, Ethereum may be on the verge of a major breakout, with technical patterns pointing to a potential price target above $4,000. In the 2017 setup, Ethereum skyrocketed past $28 from a low between $6 and $7.5 after reclaiming the 50 MA.
If history is any guide, Ethereum’s next move could propel it from its current price of $2,541 to $4,000, which aligns with the upper red horizontal line on the 2025 price chart or above the line to fresh all-time highs, with no ceiling in sight, according to the analyst.


