Monitoring liquidation levels is crucial during periods of price volatility, as they indicate where significant price movements can occur due to forced sell-offs or buy-ins.
Tools like Coinglass’s liquidation heatmap are invaluable as they visually represent where the market holds large amounts of leveraged positions, identifying potential price points where forced liquidations will occur if the price reaches these levels.
Essentially, a liquidation heatmap acts as a strategic map, showing traders potential ‘hot zones’ where volatility is likely to increase due to the unwinding of leveraged positions. This allows them to make more informed decisions about entry and exit points and risk management and potentially capitalize on the resulting market movements.
Bitcoin saw a significant drop on May 1, losing the psychologically important support at $60,000 and dropping to as low as $56,500. As of press time, its price hovers around $57,000, causing widespread losses in the market and drastically impacting what was, until recently, a very bullish sentiment.
Bitcoin’s 12% drop caused $381.76 million in liquidations in the 24 hours preceding May 1, 15:30 UTC, with $307.92 million being longs. Its drop from $60,600 to $57,000 in 12 hours wiped out $177.36 million in longs.
CoinGlass’s liquidation heatmap showed $16 million in liquidation leverage at the $56,880 price point placed within the last 24 hours. This level represented the initial significant threshold—if BTC fell to this point, it could prompt the start of liquidations, potentially leading to increased selling pressure.
Between $56,750 and $56,620, we see higher leverages added at $22.31 million and $19.22 million, respectively. The proximity of these levels suggests that a drop through these thresholds could result in a compounding effect, where sequential liquidations at each level intensify the downward price movement.
However, the most significant point is the $56,490 level, with $34.04 million in liquidation leverage. Given the substantial amount of leverage involved, a drop to this level could act as a major catalyst for a sharper price decline.
Subsequent Levels ($56,360, $56,230, and $56,100), with liquidation leverages of $23.24 million, $19.52 million, and $19.37 million, respectively, further illustrate a densely packed area where each small drop in price might trigger additional sell-offs, contributing to a potential cascading effect in liquidations.
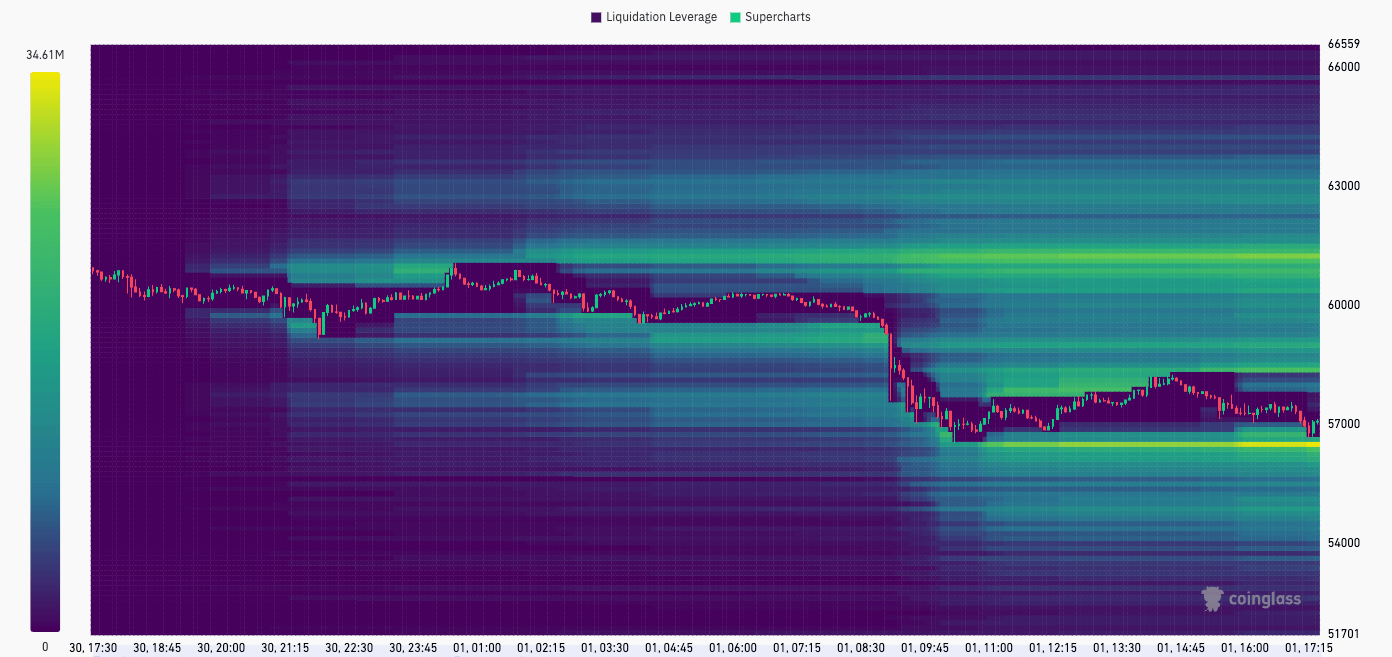
These levels show a stacked arrangement of potential triggers just below the current price, suggesting that a minor price decline could lead to a series of liquidations. Each level acts as a potential breakpoint where the price might either stabilize temporarily due to buying activity or continue to drop if selling pressure overwhelms. The concentration of liquidation points in a relatively narrow price range implies that the market could experience significant volatility if these levels are tested.
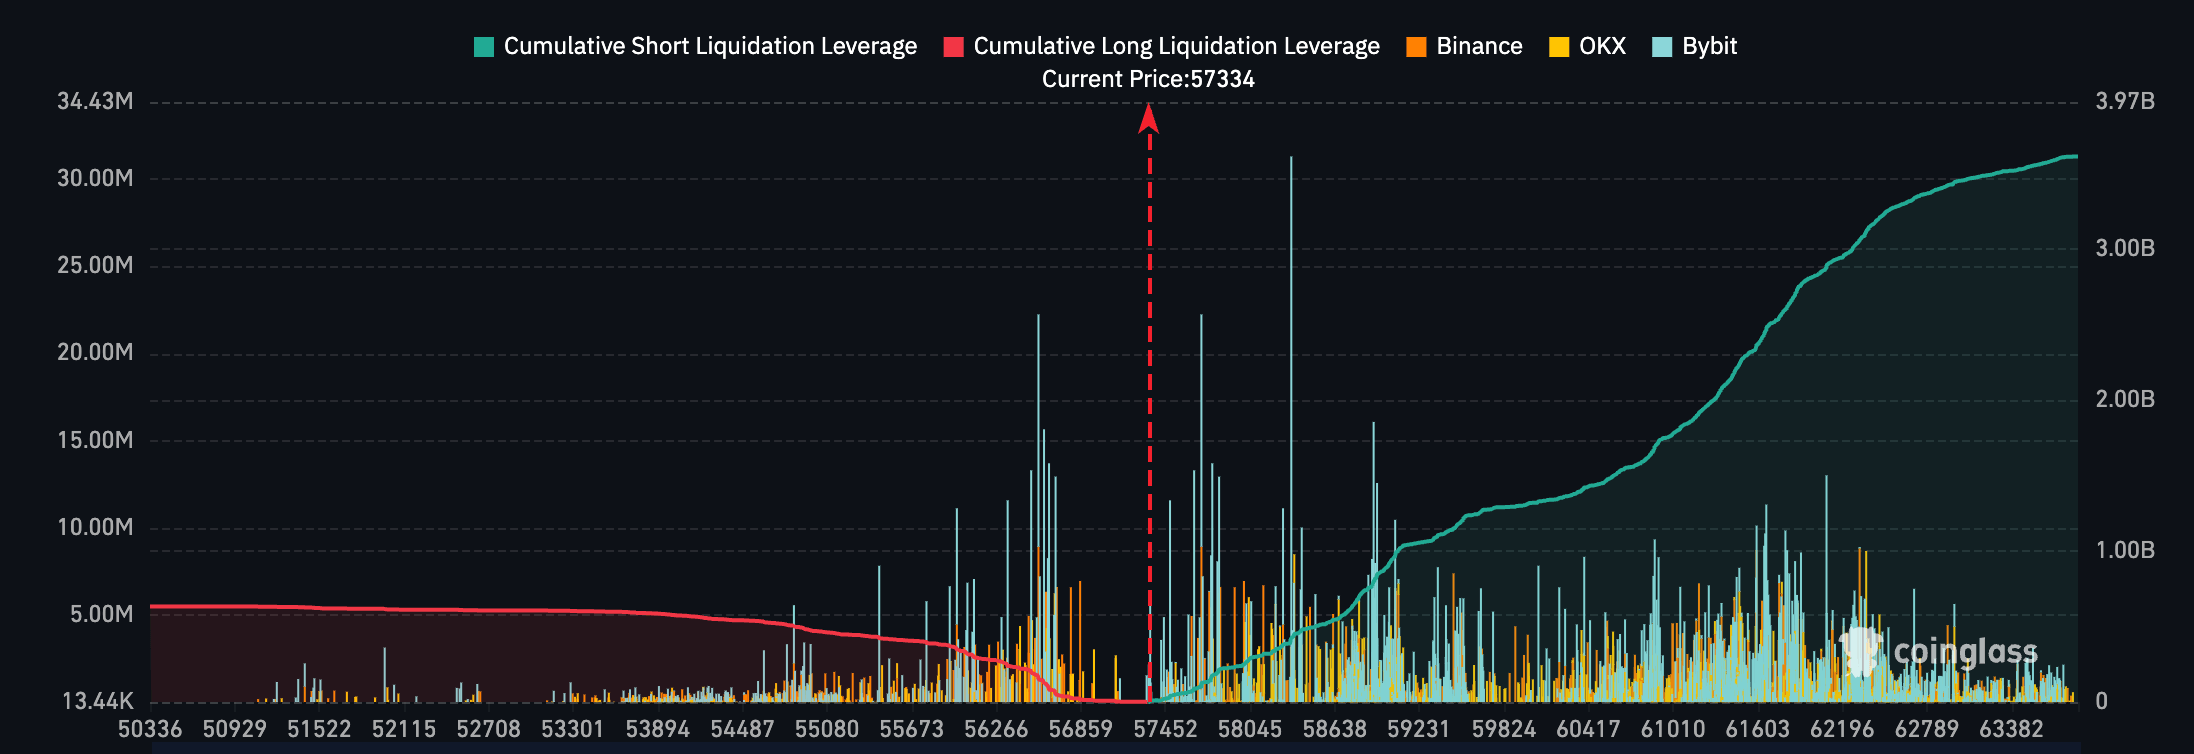
Cumulatively, the amount of leverage across OKX, Binance, and Bybit over the past day comes to over $3.5 billion. The majority of the leverage is made up of short positions up to $63,380, with only around $5 million in leveraged longs.
The post Liquidation heatmap shows volatility ahead as Bitcoin drops to $57k appeared first on CryptoSlate.


