MATIC is the native utility token of the Polygon blockchain and it is currently ranked 18th by market cap, with a total supply of 10 billion MATIC and a total trading volume of over $204 million in the last 24 hours. It has been moving upward since its last rejection at a $0.6342 support level.
Following the recent bullish trend of the crypto market, MATIC has not been left behind as the price has been on an uptrend with very strong momentum for a while now. Since its last rejection point, MATIC has seen a price reversal of over 10%.
Technical Indicators Point Toward Sustained Uptrend For MATIC
To figure out where MATIC’s price might be headed next, several indicators can be used to examine the chart;
1-Day MACD: A technical look at the MACD indicator from the 4-hour timeframe, the MACD histograms are trending above the zero line, and both the MACD line and the Signal line have crossed and are heading towards the MACD zero line, indicating a bullish trend.
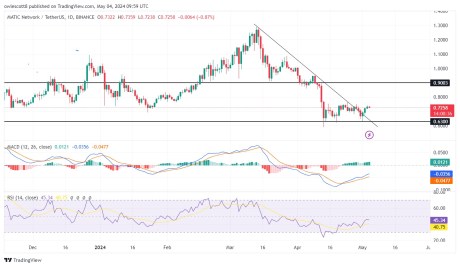
1-Day RSI: the formation of the Relative Strength Index (RSI) in the above image also suggests an upward movement as the RSI signal line is seen moving toward the 50% level. This indicates that buyers are gradually becoming active in the market therefore overpowering the strength of sellers.
4-hour Alligator: A look at the alligator indicator from the 4-hour time frame shows that the crypto asset is trading above the alligator lines as the alligator lip and teeth have both successfully crossed above the alligator jaw, suggesting that the price might continue to move in an upward direction.

Potential Price Movement
From the previous downward movement, the price of MATIC has managed to create one major resistance level of $0.7365 and one major support level of $0.6324. Currently, MATIC is moving toward this resistance level and if it breaks above this level, it might go even further to test the next resistance level of $0.7680.
However, if it fails to break above this major resistance, it will reverse and start a downward movement toward its previous support. Also, if it manages to break below this support level, the price might move further downward thereby continuing on its downtrend. As of the time of writing the price of MATIC was trading around $0.7253 and about -0.94% down in the last 24 hour


