Crypto Man MAB, in his latest analysis on X, pointed out that Optimism (OP) is now priced at $0.553, showing a mild increase of +0.004 (+0.73%) within the last four hours. While the short-term movement is slightly positive, he emphasized that the overall trend has been bearish since the asset peaked near $0.75, marking a clear phase of correction in the market.
Trend And Volume Analysis OF Optimism (PO)
Delving into the trend, Crypto Man MAB observed that the asset’s short-term trend is leaning bearish. Over the past 24 hours, the price of OP has declined from a high of $0.564 to a low of $0.483, forming a downward trajectory. He noted that the longer-term outlook reinforces this sentiment, as the asset has dropped by a steep 71.02% over the last 180 days, clearly signaling sustained downward pressure.
Turning attention to volume behavior, Crypto Man MAB emphasized the significance of recent spikes in OP’s trading volume, particularly during the sharp price decline. He explained that this increase in volume often indicates heightened market participation, most likely driven by panic selling or stop-loss triggers. The volume surge during this dip suggests that the bears are still active and in control.
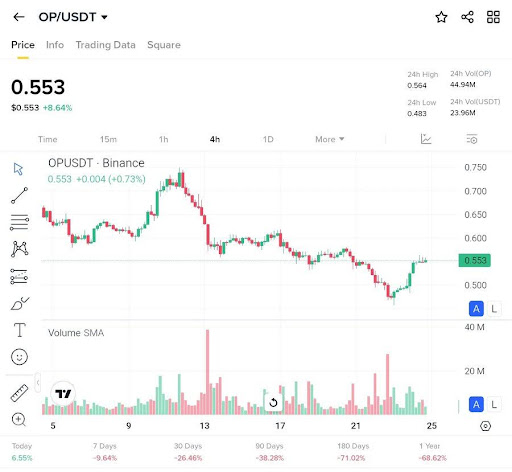
In his analysis, Crypto Man MAB further mentioned that the Volume SMA reflects periodic surges, with the most recent peak aligning with the downward movement in price. This alignment between rising volume and falling price often reflects a strong bearish sentiment, reinforcing the downward pressure seen on the chart.
Support, Resistance, And Indicators
Examining OP’s support and resistance levels, the analyst points out that the current price is trading near $0.483. This zone could act as a potential support if selling pressure begins to slow, offering a chance for a temporary stabilization or bounce. However, a sustained break below this level might signal further downside in the near term.
On the flip side, the nearest resistance lies around $0.564, which represents the 24-hour high. If the price attempts a recovery, this level will likely serve as the first barrier to overcome. A successful move above it could signal improving sentiment, though further confirmation would be needed to shift the short-term bias away from bearish.
Looking at the chart patterns, recent candlesticks show a mix of bullish and bearish activity, but the red candles have been more dominant. This pattern reinforces the ongoing downward momentum, indicating that sellers still have control. Until there is a visible shift in momentum, the overall tone remains cautious despite pockets of potential support.


