Ripple Price Prediction – February 7
The Ripple price prediction renews the bullish trend after crossing above the moving averages to touch the daily high at $0.80.
XRP/USD Market
Key Levels:
Resistance levels: $0.88, $0.92, $0.97
Support levels: $0.56, $0.51, $0.46

XRP/USD is currently following an upward roll as the coin moves to cross above the upper boundary of the channel. The Ripple price is currently hovering above the 9-day and 21-day moving averages. However, a possible bullish cross above the channel may keep the coin at the higher side.
Ripple Price Prediction: Ripple (XRP) May Cross into the Higher Side
The Ripple price is at the time of writing recovering towards the resistance level of $0.85. The initial break above the 9-day and 21-day moving averages boosted the price up. However, the Ripple (XRP) could create additional highs if the coin stays above the channel. Meanwhile, from above, more hurdles may come into play and of course, the nearest resistance level may be located at $0.85.
However, the trend remains in the hands of the bulls supported by the technical indicator where the Relative Strength Index (14) moves to cross into the overbought region, Meanwhile, a break above $0.88 and $0.92 resistance levels may most likely push the coin above the potential $0.97 resistance level while a break below the 9-day and 21-day moving averages could lead to the supports of $0.56, $0.51, and $0.46 respectively.
Against Bitcoin, the pair is consolidating to the upside and trading above the 9-day and 21-day moving averages. Meanwhile, the bulls are now pushing the price towards the upper boundary of the channel; moving near this barrier could take the price to the resistance level of 1900 SAT and above.
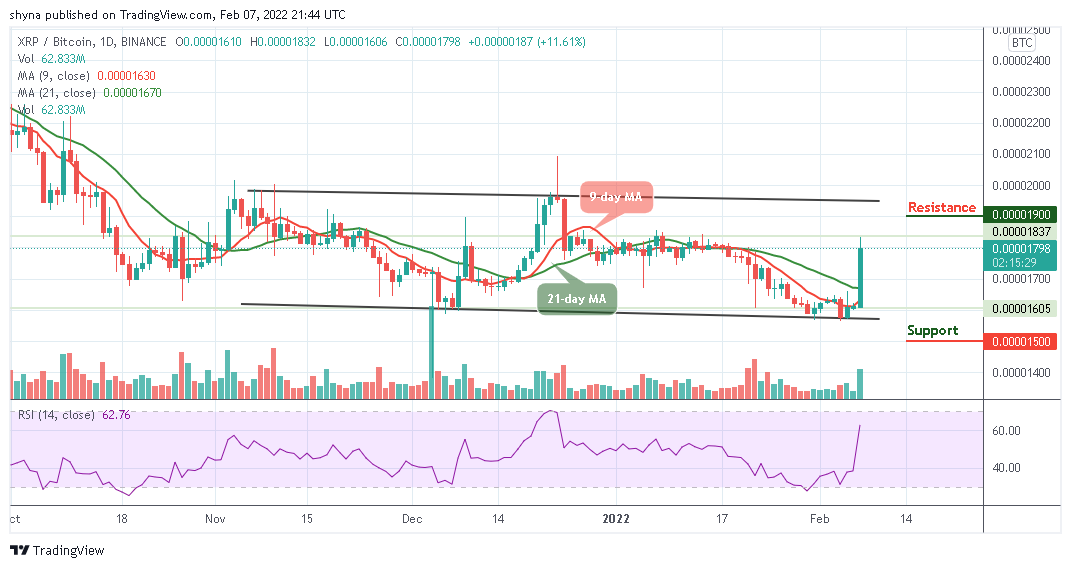
However, if the coin decides to follow the downtrend, crossing below the 9-day and 21-day MAs could bring it to the critical support level of 1500 SAT and below. Meanwhile, the technical indicator Relative Strength Index (14) is moving above 60-level, suggesting more bullish signals.
Looking to buy or trade Ripple (XRP) now? Invest at eToro!
68% of retail investor accounts lose money when trading CFDs with this provider


