Lately, the price of Solana (SOL) has been demonstrating bullish resilience and gaining significant growth above its bearish trendline. Market participants are closely watching this current price action with the $175 resistance acting as a pivotal point, and a break above it could set the stage for a potential rally that might propel the crypto asset towards the $175 mark.
As bullish sentiment around SOL continues to build, this article seeks to analyze its current price movements above the bearish trendline and the technical indicators suggesting sustained growth. The goal is to provide readers with a comprehensive understanding of SOL’s potential future trajectory.
SOL’s price was trading at approximately $169 and was up by 5.12% with a market capitalization of over $78 billion and a trading volume of over $3.5 billion as of the time of writing. In the last 24 hours, the asset’s market cap has increased by 5.21%, while its trading volume has increased by 69.07%.
Solana Eyes The $175 Mark
On the 4-hour chart, after breaking above the bearish trendline, SOL has continued to maintain its bullish momentum, trading above the 100-day Simple Moving Average (SMA). This sustained momentum could potentially set up a move toward the $175 mark.
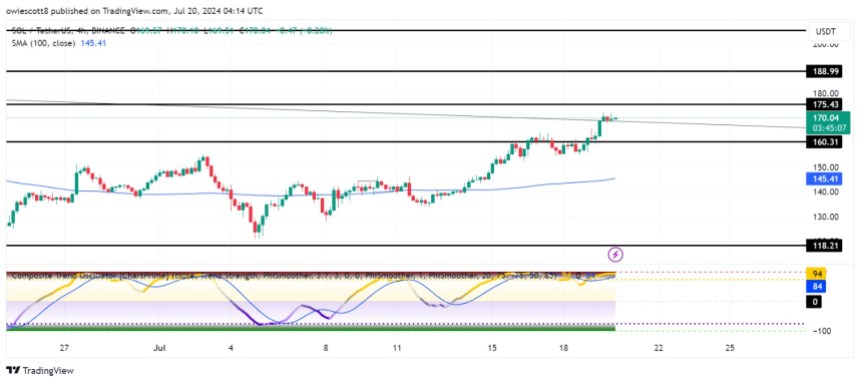
The 4-hour Composite Trend Oscillator confirms that SOL could continue its bullish trajectory above the trendline, as both the signal line and the SMA of the indicator are currently trending in the overbought zone. Also, the signal line shows no sign of crossing below the SMA.
On the 1-day chart, following the breakthrough, Solana is currently attempting a single candle bullish move toward the $175 resistance mark, trading above the 100-day SMA. This bullish momentum could potentially drive the digital asset to reach the $175 mark.
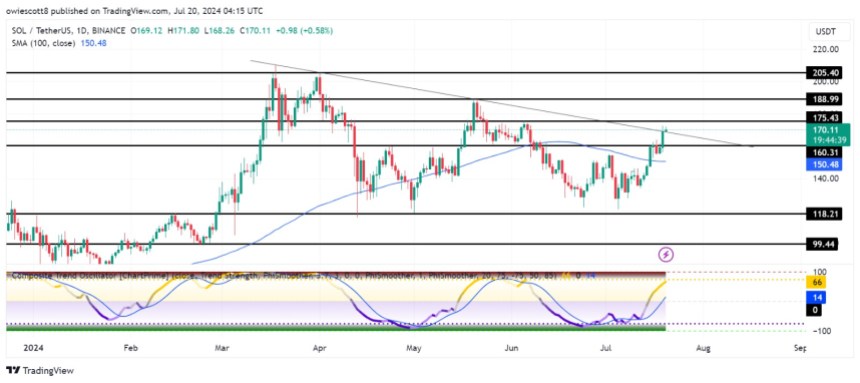
Lastly, it can be observed that the signal line has crossed above the SMA of the indicator and has crossed above the zero line, with both lines attempting to move toward the overbought zone. This formation of the composite trend oscillator suggests that SOL’s price may continue its current bullish move above the trendline toward the $175 resistance.
The Implications Of SOL’s Bullish Breakout
The current price action suggests that Solana is on the verge of igniting a bullish move above the trendline toward the $175 resistance mark. If the coin achieves this level and breaks above, it could lead to a further climb toward the $188 mark. When this level is breached, the digital asset may experience a price increase toward the $205 resistance level and possibly other levels above.
However, if Solana fails to break above the $175 resistance mark, it may start a fresh decline toward the $160 support level. Furthermore, the cryptocurrency could experience additional price drops, potentially challenging the $118 support range and possibly lower levels if this support is breached.


