Solana found support near the $192 zone. SOL price is now attempting to recover from above $200 and faces hurdles near $215.
- SOL price started a recovery wave above $200 and $202 against the US Dollar.
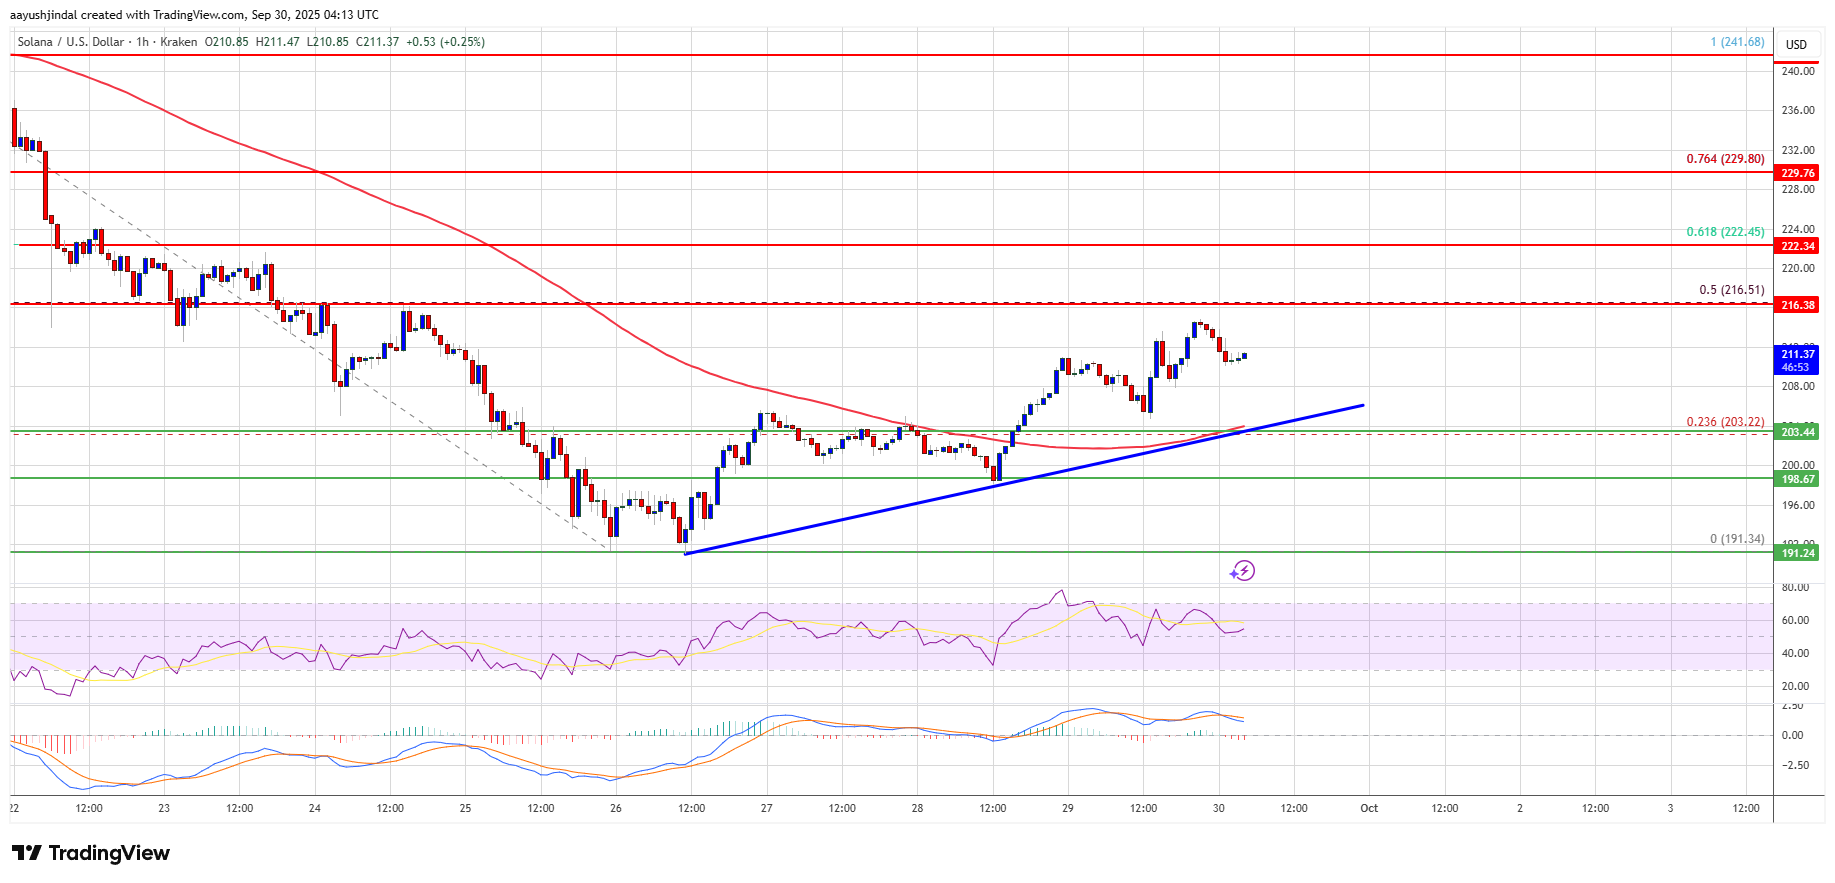
- The price is now trading above $202 and the 100-hourly simple moving average.
- There is a connecting bullish trend line forming with support at $204 on the hourly chart of the SOL/USD pair (data source from Kraken).
- The price could start another decline if it stays below $215 and $220.
Solana Price Eyes Recovery
Solana price extended losses below $200 before the bulls took a stand, like Bitcoin and Ethereum. SOL tested the $192 zone and recently started a recovery wave.
The price was able to surpass the $200 and $202 resistance levels. There was a move above the 23.6% Fib retracement level of the downward move from the $242 swing high to the $191 low. Besides, there is a connecting bullish trend line forming with support at $204 on the hourly chart of the SOL/USD pair.
However, the price faces many hurdles near $215. Solana is now trading above $205 and the 100-hourly simple moving average. If there are more gains, the price could face resistance near the $215 level. The next major resistance is near the $216 level or the 50% Fib retracement level of the downward move from the $242 swing high to the $191 low. The main resistance could be $220.
A successful close above the $220 resistance zone could set the pace for another steady increase. The next key resistance is $230. Any more gains might send the price toward the $242 level.
Another Drop In SOL?
If SOL fails to rise above the $216 resistance, it could continue to move down. Initial support on the downside is near the $204 zone and the trend line. The first major support is near the $202 level.
A break below the $202 level might send the price toward the $200 support zone. If there is a close below the $200 support, the price could decline toward the $192 support in the near term.
Technical Indicators
Hourly MACD – The MACD for SOL/USD is losing pace in the bullish zone.
Hourly Hours RSI (Relative Strength Index) – The RSI for SOL/USD is above the 50 level.
Major Support Levels – $204 and $200.
Major Resistance Levels – $216 and $220.


