Solana started a fresh decline below the $165 pivot zone. SOL price is now attempting to recover and faces hurdles near the $165 zone.
- SOL price started a fresh decline below $162 and $160 against the US Dollar.
- The price is now trading below $162 and the 100-hourly simple moving average.
- There is a new bearish trend line forming with resistance at $159 on the hourly chart of the SOL/USD pair (data source from Kraken).
- The price could continue to move up if it clears $160 and $162.
Solana Price Faces Hurdles
Solana price extended losses below $150 before the bulls appeared, like Bitcoin and Ethereum. SOL tested the $145 zone and recently started a recovery wave.
There was a move above the $150 and $155 resistance levels. The price climbed above the 23.6% Fib retracement level of the downward move from the $188 swing high to the $145 low. However, the bears remained active near the $162-$165 resistance zone.
Besides, there is a new bearish trend line forming with resistance at $159 on the hourly chart of the SOL/USD pair. Solana is now trading below $162 and the 100-hourly simple moving average.
On the upside, immediate resistance is near the $160 level and the trend line. The next major resistance is near the $162 level. The main resistance could be $165. A successful close above the $165 resistance zone could set the pace for another steady increase.
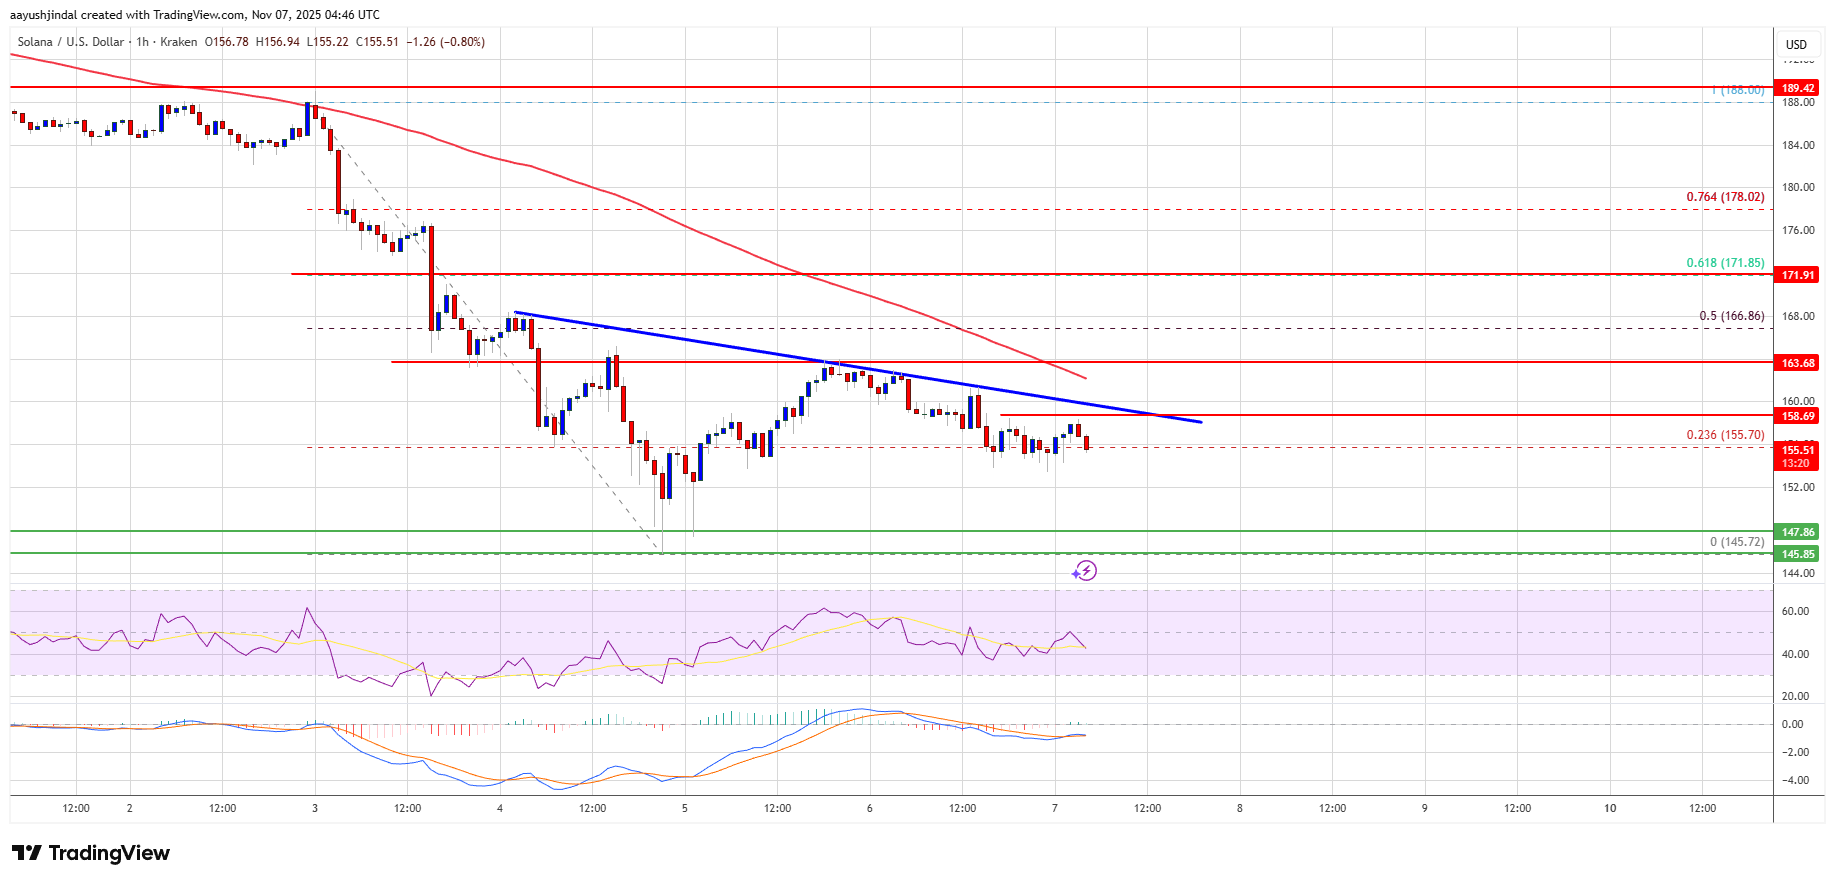
The next key resistance is $172 and the 61.8% Fib retracement level of the downward move from the $188 swing high to the $145 low. Any more gains might send the price toward the $180 level.
Another Decline In SOL?
If SOL fails to rise above the $160 resistance, it could continue to move down. Initial support on the downside is near the $150 zone. The first major support is near the $145 level.
A break below the $145 level might send the price toward the $138 support zone. If there is a close below the $138 support, the price could decline toward the $130 zone in the near term.
Technical Indicators
Hourly MACD – The MACD for SOL/USD is gaining pace in the bearish zone.
Hourly Hours RSI (Relative Strength Index) – The RSI for SOL/USD is below the 50 level.
Major Support Levels – $150 and $145.
Major Resistance Levels – $160 and $165.


