Toncoin (TON) is starting to make waves again, showing signs of renewed strength after successfully breaking out of a long-standing descending channel on the daily chart. This breakout marks a pivotal moment for the token, potentially signaling the end of the recent downtrend and hinting at the early stages of a fresh uptrend.
As the crypto market shows signs of renewed vigor, Toncoin appears to be positioning itself as one of the standout performers of this emerging cycle. Whether this breakout marks the beginning of a sustained uptrend or faces temporary headwinds will depend on both technical follow-through and broader market sentiment.
A Potential Uptrend In The Making
According to Profit Demon in a recent post on X, Toncoin is demonstrating significant strength by staying above the descending channel on its daily chart. This technical formation is crucial as it signals a shift in market dynamics after a period of weakness and decline.
Profit Demon noted that TON had previously faced a sharp correction. However, the latest price action indicates a recovery, with Toncoin finding solid support at a key level. This level now serves as a critical foundation, offering the potential for a new upward move.
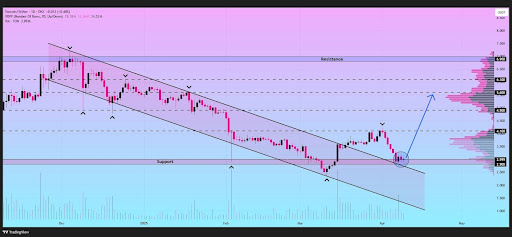
He further emphasized that if the bullish momentum continues to grow, TON could target several key resistance levels. With the current market sentiment favoring a recovery, Toncoin’s price may rise toward the $4.10 level. A successful breakout above this mark would solidify the bullish trend, propelling it to the $4.90 and $5.60 marks.
Can Toncoin Sustain Current Trends and Trigger A Rally?
For TON to sustain its rally, the Relative Strength Index (RSI) plays a key role. The RSI should stay within the optimal range of 40 to 70, avoiding overbought conditions above 70. If the RSI remains above 50 and outside overbought territory, Toncoin will have room for further appreciation. A breakout above key resistance levels while keeping the RSI in this range would strengthen the bullish case.
The Moving Average Convergence Divergence (MACD) is another critical indicator to monitor. Currently, the MACD has shown signs of bullish divergence, suggesting that momentum is shifting in favor of the bulls. For the rally to continue, the MACD line should remain above the signal line, confirming that buying pressure outweighs selling pressure.
Lastly, volume analysis is essential in confirming the strength of the price movement. A rally supported by increasing volume signals that the trend is backed by real demand and a temporary spike. To sustain an upward movement, trading volume must rise as TON breaks through resistance levels. Higher volume indicates genuine interest from traders, which strengthens the trend, while lower volume may suggest a lack of conviction, limiting the rally’s longevity.


