Ethereum has pushed above the $3,350 level, injecting fresh momentum into the market after weeks of uncertainty. Yet despite this breakout, overall sentiment remains clouded by fear, with many analysts still warning that the broader structure points toward a developing bear market. Traders now find themselves at a pivotal juncture: is this the beginning of a sustained recovery, or merely a temporary rally before further downside?
According to a new CryptoQuant report, one of the most revealing indicators right now is Ethereum’s funding rate behavior across major exchanges. Unlike the explosive funding spikes seen during the two major rallies earlier this year, the current move shows a remarkably restrained funding environment. During those earlier surges, funding rates climbed aggressively into overheated territory, signaling euphoric long leverage and speculative excess — conditions that closely preceded short-term market tops.
This time, however, funding remains far more subdued. The absence of aggressive long positioning suggests that the current rally is not being driven by excessive leverage, which gives the move a different character compared to earlier spikes. Whether this signals healthier accumulation or simply a lack of conviction remains the core question as Ethereum approaches the next decisive phase.
Muted Funding Rates Highlight a Cautious But Potentially Constructive Rally
The CryptoQuant report highlights that, unlike previous explosive rallies, Ethereum’s current funding rates remain unusually low, even after its sharp recovery from the $2.8K region. This subdued funding environment signals that the derivatives market is not yet saturated with speculative long positions.
Buyers are stepping in, but modest leverage drives this move compared to past phases dominated by aggressive traders. Consequently, spot accumulation drives the current advance more than overheated futures activity.

This difference carries important implications. Without a surge in speculative demand, Ethereum may struggle to ignite the kind of full bullish continuation leg seen in earlier breakout cycles. Historically, strong uptrends have required funding rates to expand meaningfully as traders chase price, forcing shorts to cover and fueling upward momentum. That behavior has not yet emerged in the current structure.
However, this muted landscape is not inherently bearish. Instead, it reflects a recovering market, not an overextended one. This leaves Ethereum with room to climb further — if demand strengthens. At the same time, the lack of leverage means the rally remains vulnerable; strong resistance rejections could quickly weaken momentum unless fresh buyers step in.
Testing Key Resistance as Momentum Builds
Ethereum’s daily chart shows a notable shift in momentum as the price pushes toward $3,320, extending its rebound from the sub-$2,800 lows. This recovery phase has been steady rather than explosive, reflecting a market that is stabilizing but still facing key overhead challenges.
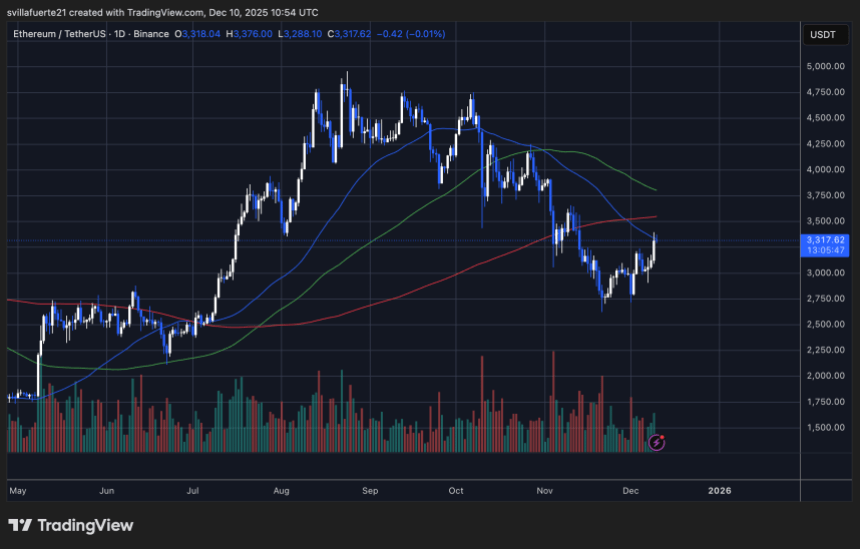
The first major test is the 200-day moving average (red line), which ETH is now approaching after several weeks of trading below it. Historically, reclaiming this level has marked the transition from corrective phases into renewed bullish cycles, but a clean breakout is far from guaranteed.
The structure of the recent move highlights improving buyer confidence: ETH has formed a series of higher lows, indicating accumulation after the capitulation-like November drop. Although buyers are active, the relatively subdued volume profile suggests they lack broad-based conviction. A stronger influx of volume must flip the trend decisively bullish.
The 50-day and 100-day moving averages remain above the current price and are both aligned downward, reinforcing that ETH is still technically in a broader downtrend. For momentum to extend, Ethereum must break above the $3,350–$3,400 resistance zone, where prior support turned into resistance.
Featured image from ChatGPT, chart from TradingView.com


