Crypto analyst Osemka is drawing a direct structural comparison between XRP’s current consolidation and the final base gold printed before its breakout to fresh highs. According to his charts, XRP/USD on the two-day timeframe is trading in what he characterizes as a reaccumulation range rather than a topping pattern.
Will XRP Follow Gold’s Pattern?
The structure is labeled in classic Elliott Wave A-B-C form, with the C leg ending in what he calls a “Spring.” The October 10 crash marks the Wyckoff terms the final violent liquidation wick that clears late longs and forces capitulation before the next markup phase.

The XRP chart shows price capped by a horizontal resistance band near the local top marked “B,” with that B high sitting above $3.40 and extending toward roughly $3.66 at the peak. After that move, XRP retraced into a sideway band where Osemka labels internal subdivisions “a,” “b,” and “c,” implying a corrective internal chop inside the broader range.
The lower boundary of the range is drawn in the $1.62 area. This lower boundary is simultaneously labeled “A” and described as the base of Reaccumulation, implying that buyers repeatedly defended that zone. The subsequent rally back toward the upper boundary defined the “B” top. What followed was a final flush into “C,” which he explicitly tags “Spring,” with the wick piercing below prior support and then snapping back above $2.20–$2.30 and into the ~$2.58 region shown on the chart.
The message is that the C wave was fast, deep, and terminal. He calls it “a sharp ending in the C wave,” adding that this is “very common.” In classical Elliott interpretation, an A-B-C corrective move that ends with an aggressive C spike often resolves with trend continuation in the direction of the original impulse. In his wording, the surge established the impulse, and everything since has been digestion, not distribution. He argues that “it is hard to see this range as anything less than a long reaccumulation after November’s surge.”
Notably, Osemka places XRP’s pattern next to gold’s weekly chart during its own multi-quarter sideways phase. Gold’s structure is annotated almost identically: an “A” low anchored around roughly $1,680–$1,700 per ounce, a mid-range chop labeled “a / b / c,” a “B” high pressing into the $2,050–$2,100 ceiling, and finally a “C” leg that undercut that same $1,700 floor before reversing.
When gold finally pushed through the long-capped $2,100 area in July 2024 and broke into sustained new all-time highs near $2,480, that break acted like a trigger: safe-haven demand, Fed rate-cut expectations and central bank buying drove an almost uninterrupted vertical phase in the metal, and over the following months gold kept taking out round numbers — $2,500, $3,000, $4,000 and beyond — ultimately stretching more than 80% higher from that $2,100 breakout zone to reach about $4,381 per ounce at the peak.
By placing XRP and gold side by side, using the same lettering, same boundary logic, and the same “Spring” terminology, Osemka is presenting XRP as sitting at the equivalent moment gold occupied just before its parabolic run.
“This one is for the XRP community, where I see some gurus preaching for the end of the cycle. Bros, it is hard to see this range as anything less than a long reaccumulation after November’s surge. In Elliott wave terms: an ABC with a sharp ending in the C wave. Very common. Last shakeout or Spring. There is basically no difference to this reaccumulation example on Gold years ago. Thank me later,” the analyst concluded.
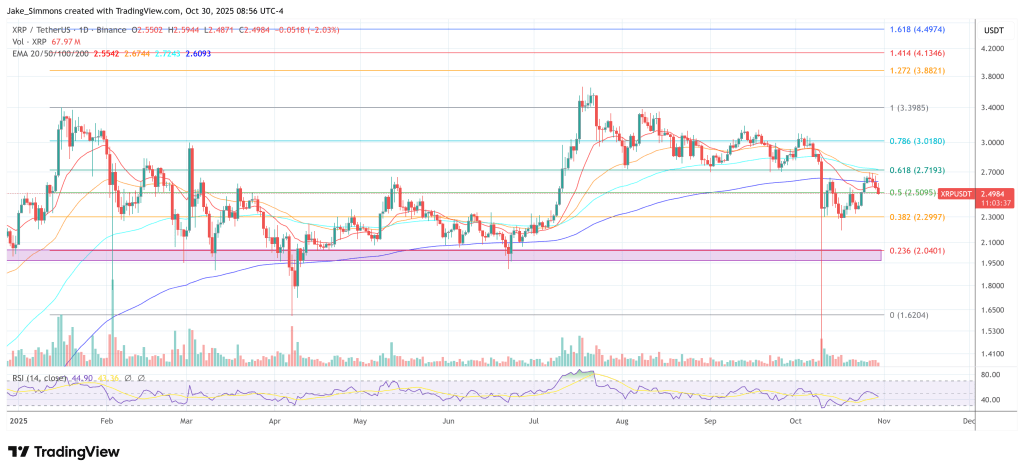
At press time, XRP traded at $2.49.