XRP is under heavy selling pressure as the broader crypto market struggles with uncertainty, risk aversion, and fading bullish momentum. Fear continues to spread across investors, and liquidity conditions are tightening, putting additional weight on assets that previously demonstrated strength.
One of the clearest signs of stress now comes from Binance data — the largest trading platform by volume — showing that XRP Open Interest has dropped to its lowest level since November 2024. This decline highlights a significant shift in trader positioning, signaling that speculative appetite is drying up and leverage is being unwound across the market.
According to the latest derivatives metrics, XRP is entering a critical phase marked by weakening sentiment and a steady loss of momentum. The sharp contraction in Open Interest reflects reduced participation from both long and short traders, suggesting that the market currently lacks conviction to support a sustained directional move. This shift comes at a time when XRP had previously been attempting to stabilize above key psychological levels, but continued selling pressure has prevented a clean rebound.
XRP Derivatives Show Liquidity Drain and Bearish Control
A CryptoQuant report from Arab Chain reveals a sharp deterioration in XRP derivatives conditions, highlighting growing stress across the market. Open Interest on Binance has fallen dramatically from record highs above $1.7 billion to nearly $504 million, and briefly down to $473 million.

This steep contraction reflects a major outflow of liquidity from both long and short positions, signaling that traders no longer have the conviction needed to sustain a clear directional trend. The decline in OI aligns closely with XRP’s price drop to $2, after trading above the $2.5–$3 range in recent weeks. This correlation suggests that traders are not reopening positions after being flushed out, leaving the market driven by short-term flows rather than sustained accumulation.
Funding rates reinforce this weakness. Over the past two months, funding has frequently turned negative, showing that short sellers are willing to pay to maintain their positions. Negative funding typically indicates that selling pressure outweighs buying demand, increasing the probability of continued downside unless fresh liquidity enters the market.
Taken together — collapsing Open Interest, persistent negative funding, and declining price action — the data paints a picture of deep fragility. There are no visible signs of meaningful accumulation from whales or institutions, and without a reversal in derivatives behavior, XRP remains firmly under seller control.
XRP Price Shows Weak Rebound After Breakdown
XRP continues to struggle under heavy market pressure, and the chart reflects a clear loss of bullish structure. After failing to hold above the $2.50–$2.70 range, price broke down sharply and recently tagged lows near $1.90 before attempting a modest rebound.
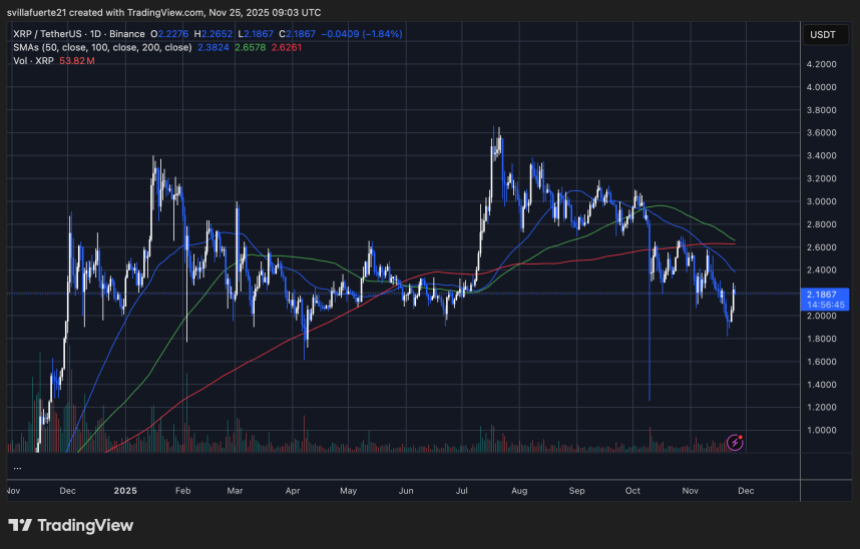
The rejection from the 50-day and 100-day moving averages shows that sellers remain firmly in control, with both moving averages now sloping downward — a sign of sustained bearish momentum. Additionally, XRP remains below the 200-day moving average, reinforcing the broader downside bias and signaling that the market has not yet regained long-term support.
Volume spikes during selloffs highlight capitulation-driven moves rather than accumulation, while the weaker volume on recent green candles suggests limited conviction behind the bounce. Each recovery attempt has been met with resistance, forming lower highs and lower lows — a classic bearish continuation pattern.
To shift sentiment, XRP would need to reclaim the $2.40 level and consolidate above it; otherwise, the risk of retesting $1.90 or even falling toward $1.70 remains elevated.
Featured image from ChatGPT, chart from TradingView.com


