After the initial excitement surrounding Ripple Lab’s partial legal victory against the US Securities and Exchange Commission (SEC) subsided, XRP experienced a decline that led it to test its 4-month support line at $0.4240.
However, the cryptocurrency has demonstrated resilience by reclaiming its important psychological level of $0.50 and reentering its previous consolidation or accumulation zone. This renewed stability has sparked optimism among bullish investors, indicating a potential rebound for XRP.
Presently, XRP is trading at $0.5295 with a 24-hour trade volume of $1,419,623,015.56. This reflects a 1.89% increase in price over the last 24 hours and a 1.60% increase over the past 7 days.
These gains and a promising chart formation suggest that XRP may be poised for further growth in the days and months ahead.
Potential XRP Breakout As 2-Month Candle Nears Conclusion
Crypto analyst Egrag Crypto, known for insightful market analysis, recently took to the social media platform X (formerly Twitter) to highlight an intriguing development in the XRP market.
As the two-month candle for XRP draws to a close, it displays the potential formation of an inverted hammer pattern.
For further context, the inverted hammer is a technical analysis candlestick pattern that typically appears at the end of a downtrend. It is characterized by a small body at the candle’s upper end, with a long upper shadow and little to no lower shadow.
The inverted hammer pattern suggests a potential reversal in price direction. It indicates that buyers have stepped in after a period of selling pressure, causing the price to bounce back from its lows.
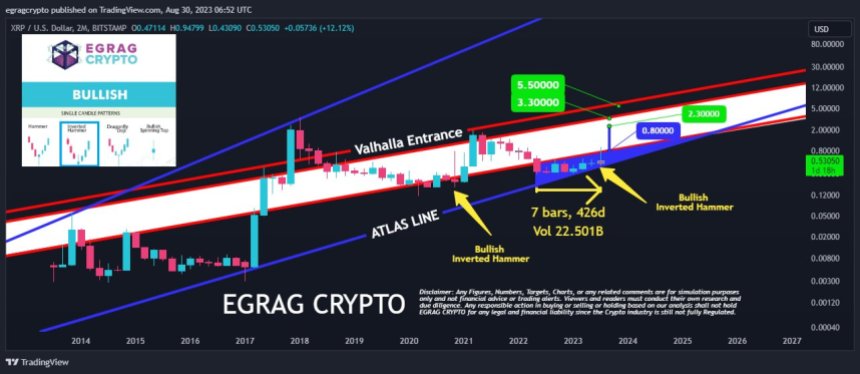
As seen in Egrag’s chart above, throughout 426 days, XRP has demonstrated remarkable resilience, maintaining its market structure and solidifying its foundation amidst market fluctuations. On this note, Egrag further claimed:
The chart unequivocally illustrates this trend, consistent with my earlier analyses wherein I underlined the significance of the 0.80c mark as a pivotal macro resistance level. Establishing this price range as a foundation marks a highly bullish macro stance.
Notably, per the information compiled by the analyst, this consolidation around the mentioned price range indicates a highly bullish macro stance for XRP
Egrag Crypto predicts a scenario where the upcoming candle could propel XRP towards the $2.3 range. However, this achievement would merely serve as a stepping stone within a larger macro range of $3.3 to $5.5, signaling a seamless continuation of XRP’s upward trajectory.
Egrag Crypto’s symbolic reference to Valhalla beyond the $5.5 threshold reflects the analyst’s belief in the substantial potential for XRP’s future growth. While these words evoke a sense of grandeur, they emphasize the possibility of XRP reaching unprecedented heights in the market.
Amidst growing anticipation within the crypto community, all eyes are on the impending conclusion of the two-month candle, which holds the key to a potential breakout indicated by the inverted hammer formation.
This pivotal moment raises questions about whether the cryptocurrency and the broader market are on the cusp of another upward trend, supported by favorable macro conditions, or if they will face a test of lower resistance levels again.
Featured image from iStock, chart from TradingView.com


