XRP price started a fresh increase above the $2.150 zone. The price is now consolidating and facing hurdles near the $2.250 level.
- XRP price started a fresh increase and climbed above the $2.20 zone.
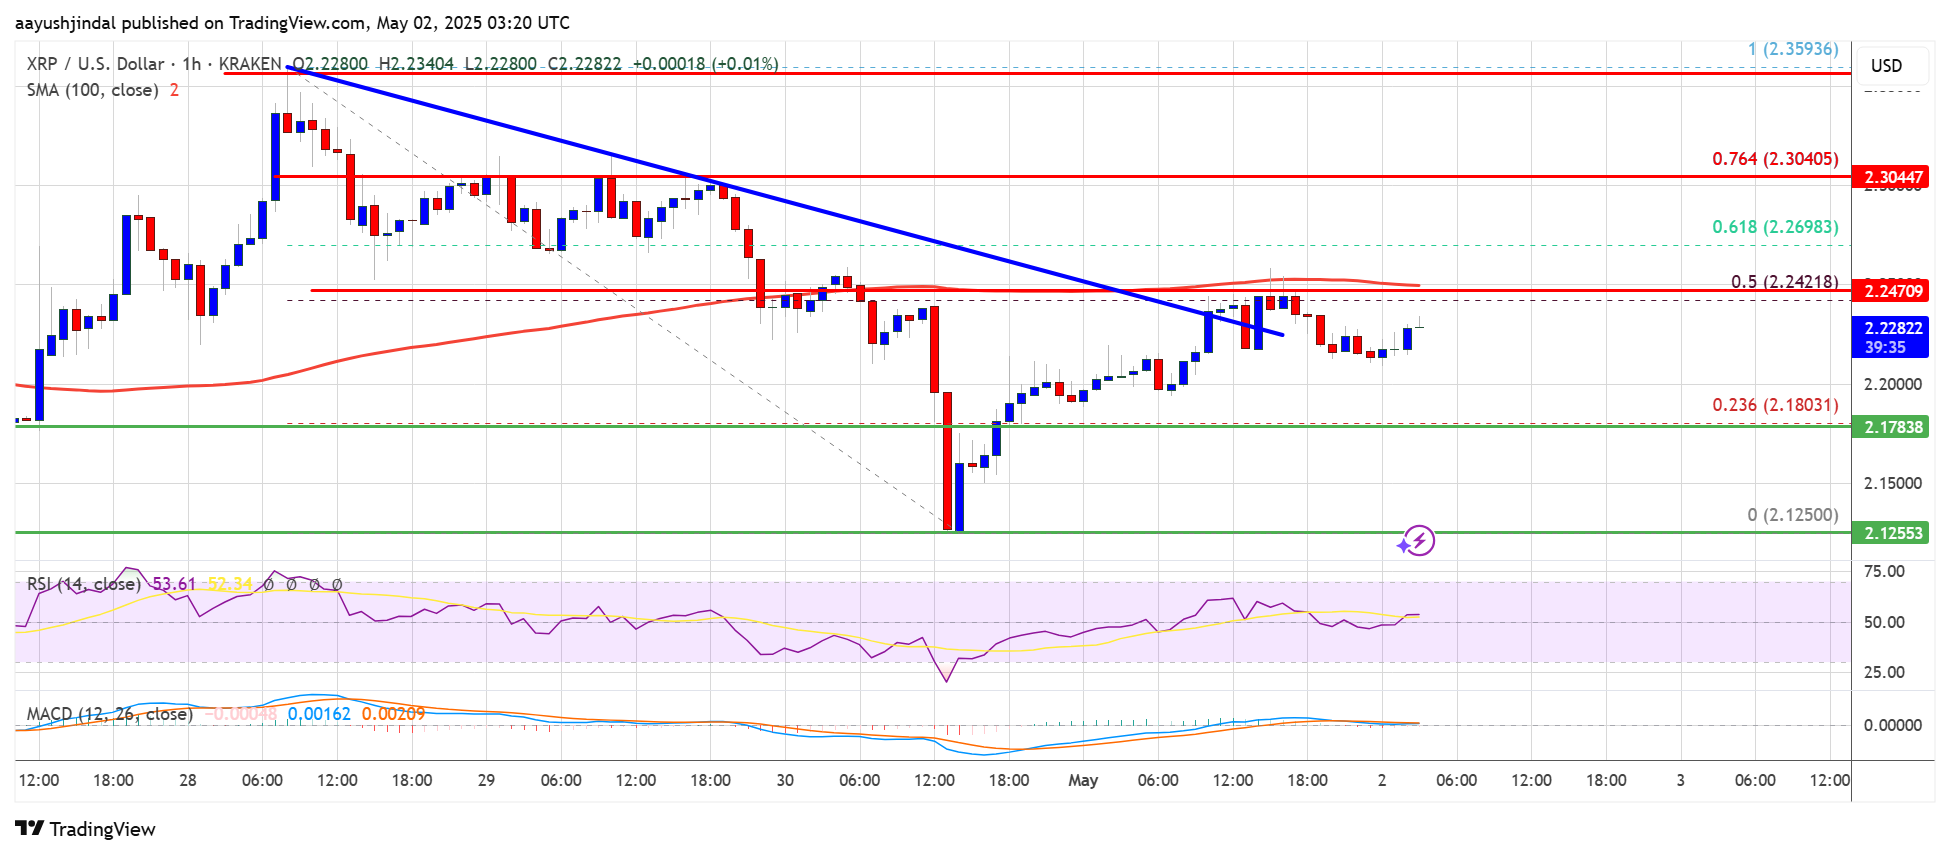
- The price is now trading below $2.250 and the 100-hourly Simple Moving Average.
- There was a break above a connecting bearish trend line with resistance near $2.2350 on the hourly chart of the XRP/USD pair (data source from Kraken).
- The pair might start another increase if there is a close above the $2.250 resistance.
XRP Price Eyes Fresh Surge
XRP price remained supported above $2.125 and started a decent increase, but it lagged Bitcoin and Ethereum. The price was able to surpass the $2.150 and $2.20 resistance levels.
There was a move above the 23.6% Fib retracement level of the downward move from the $2.359 swing high to the $2.1250 low. Besides, there was a break above a connecting bearish trend line with resistance near $2.2350 on the hourly chart of the XRP/USD pair.
The price is now trading below $2.250 and the 100-hourly Simple Moving Average. On the upside, the price might face resistance near the $2.250 level. The first major resistance is near the $2.30 level and 76.4% Fib retracement level of the downward move from the $2.359 swing high to the $2.1250 low.
The next resistance is $2.350. A clear move above the $2.350 resistance might send the price toward the $2.420 resistance. Any more gains might send the price toward the $2.450 resistance or even $2.50 in the near term. The next major hurdle for the bulls might be $2.650.
Dips Supported?
If XRP fails to clear the $2.250 resistance zone, it could start another decline. Initial support on the downside is near the $2.20 level. The next major support is near the $2.180 level.
If there is a downside break and a close below the $2.180 level, the price might continue to decline toward the $2.120 support. The next major support sits near the $2.050 zone.
Technical Indicators
Hourly MACD – The MACD for XRP/USD is now gaining pace in the bullish zone.
Hourly RSI (Relative Strength Index) – The RSI for XRP/USD is now above the 50 level.
Major Support Levels – $2.20 and $2.120.
Major Resistance Levels – $2.250 and $2.30.


