XRP price is moving higher from the $0.4540 support. The price could start a fresh rally if there is a clear move above the $0.600 resistance.
- XRP is attempting a fresh increase from the $0.4540 support level.
- The price is now trading below $0.5950 and the 100 simple moving average (4 hours).
- There is a key bearish trend line forming with resistance near $0.6080 on the 4-hour chart of the XRP/USD pair (data source from Kraken).
- The pair start a fresh rally if it clears the $0.600 and $0.608 resistance levels.
XRP Price Faces Hurdles
This past week, XRP price saw a sharp decline below the $0.550 level. The price declined below the $0.500 support and even spiked below $0.480. A low was formed near $0.4541, and the price is now moving higher, like Bitcoin and Ethereum.
There was a move above the $0.500 and $0.520 resistance levels. The bears cleared the 61.8% Fib retracement level of the main drop from the $0.640 swing high to the $0.454 swing low. However, the price is still below $0.5950 and the 100 simple moving average (4 hours).
On the upside, immediate resistance is near the $0.595 zone or the 76.4% Fib retracement level of the main drop from the $0.640 swing high to the $0.454 swing low. The first key resistance is near $0.600 and $0.608. There is also a key bearish trend line forming with resistance near $0.6080 on the 4-hour chart of the XRP/USD pair.
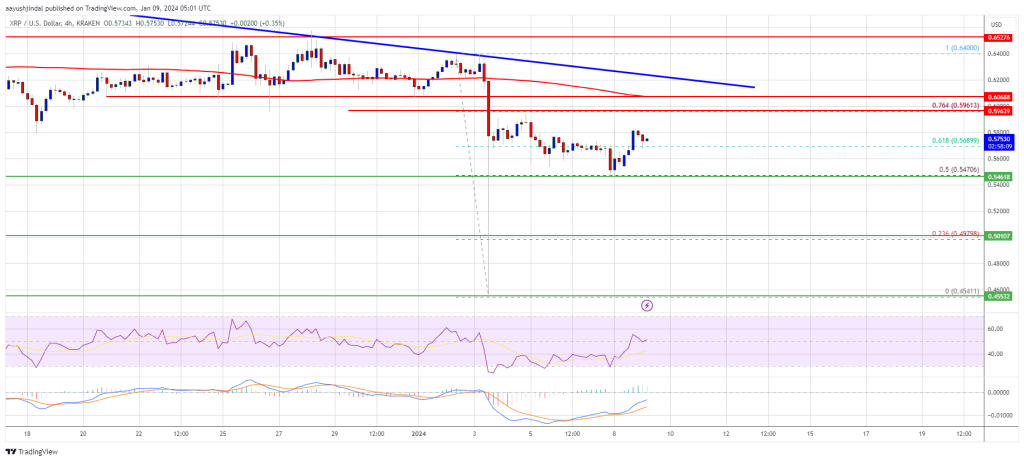
Source: XRPUSD on TradingView.com
A close above the $0.6080 resistance zone could spark a strong increase. The next key resistance is near $0.640. If the bulls remain in action above the $0.640 resistance level, there could be a rally toward the $0.670 resistance. Any more gains might send the price toward the $0.700 resistance.
Another Drop?
If XRP fails to clear the $0.608 resistance zone, it could start a fresh decline. Initial support on the downside is near the $0.550 zone.
The next major support is at $0.520. If there is a downside break and a close below the $0.520 level, XRP price might accelerate lower. In the stated case, the price could retest the $0.500 support zone.
Technical Indicators
4-Hours MACD – The MACD for XRP/USD is now gaining pace in the bullish zone.
4-Hours RSI (Relative Strength Index) – The RSI for XRP/USD is now above the 50 level.
Major Support Levels – $0.550, $0.520, and $0.500.
Major Resistance Levels – $0.595, $0.600, and $0.608.


