XRP price is holding the key support at $0.5220. The bulls could aim for a fresh increase unless there is a close below the $0.5220 support.
- XRP is struggling to start a fresh increase above the $0.5350 resistance zone.
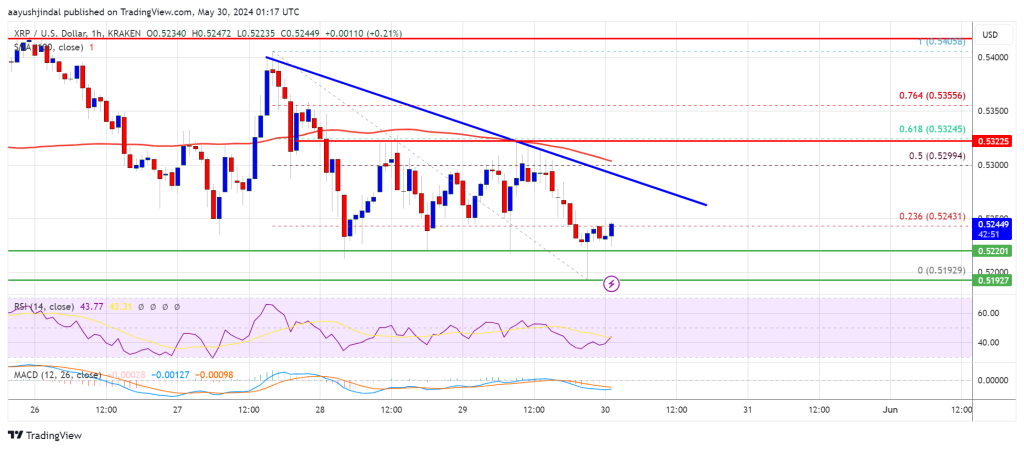
- The price is now trading below $0.5320 and the 100-hourly Simple Moving Average.
- There is a key bearish trend line forming with resistance near $0.5280 on the hourly chart of the XRP/USD pair (data source from Kraken).
- The pair could start a fresh increase unless the bears push the price below $0.5220.
XRP Price Holds Support
XRP price again saw a bearish move and retested the $0.5220 support zone like Bitcoin and Ethereum. There was also a spike below the $0.5220 support zone, but the bulls were active.
A low was formed at $0.5192 and the price is back above $0.5220. The price is now trading near the 23.6% Fib retracement level of the downward wave from the $0.5405 swing high to the $0.5192 low. It is now trading below $0.5320 and the 100-hourly Simple Moving Average.
On the upside, the price is facing resistance near the $0.5280 level. There is also a key bearish trend line forming with resistance near $0.5280 on the hourly chart of the XRP/USD pair.
The first key resistance is near $0.5300 or the 61.8% Fib retracement level of the downward wave from the $0.5405 swing high to the $0.5192 low. A close above the $0.5300 resistance zone could send the price higher. The next key resistance is near $0.540.
If there is a close above the $0.540 resistance level, there could be a steady increase toward the $0.5450 resistance. Any more gains might send the price toward the $0.5650 resistance.
More Downsides?
If XRP fails to clear the $0.5280 resistance zone, it could continue to move down. Initial support on the downside is near the $0.5220 level.
The next major support is at $0.5120. If there is a downside break and a close below the $0.5120 level, the price might accelerate lower. In the stated case, the price could decline and retest the $0.50 support in the near term.
Technical Indicators
Hourly MACD – The MACD for XRP/USD is now losing pace in the bearish zone.
Hourly RSI (Relative Strength Index) – The RSI for XRP/USD is now below the 50 level.
Major Support Levels – $0.5220 and $0.5120.
Major Resistance Levels – $0.5280 and $0.5300.


