XRP price started another decline after it failed to surpass the $0.530 resistance. The price is back below $0.5150 and showing a few bearish signs.
- XRP struggled near $0.5300 and started a fresh decline.
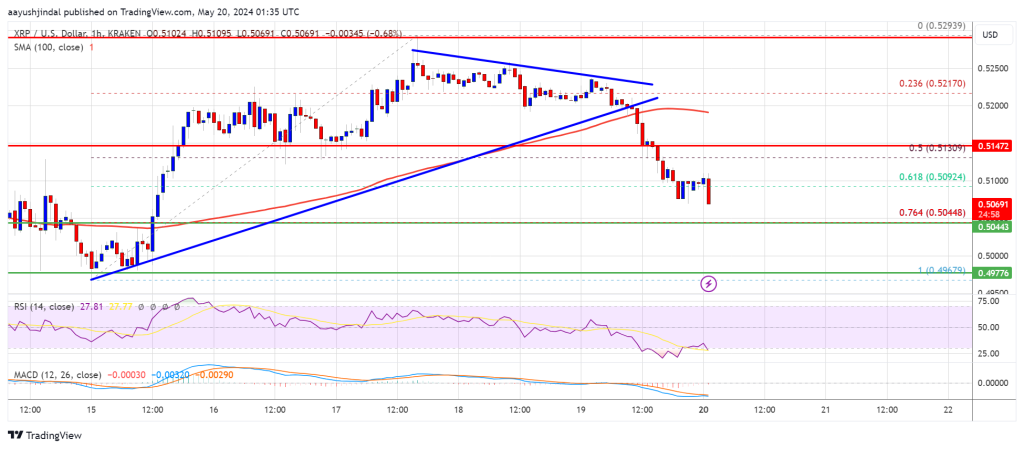
- The price is now trading below $0.5150 and the 100-hourly Simple Moving Average.
- There was a break below a key contracting triangle with support at $0.520 on the hourly chart of the XRP/USD pair (data source from Kraken).
- The pair could gain bearish momentum if there is a close below $0.500.
XRP Price Turns Red
After a steady increase, XRP price faced resistance near the $0.530 zone. A high was formed at $0.5293 and the price started a downside correction like Bitcoin and Ethereum. The price declined below the $0.5220 level.
There was a move below the 50% Fib retracement level of the upward wave from the $0.4967 swing low to the $0.5293 high. Besides, there was a break below a key contracting triangle with support at $0.520 on the hourly chart of the XRP/USD pair.
The price is now trading below $0.5150 and the 100-hourly Simple Moving Average. Immediate resistance is near the $0.5150 level. The first key resistance is near $0.520.
A close above the $0.520 resistance zone could send the price higher. The next key resistance is near $0.5220. If the bulls push the price above the $0.5280 resistance level, there could be a fresh move toward the $0.5350 resistance. Any more gains might send the price toward the $0.550 resistance.
More Losses?
If XRP fails to clear the $0.5150 resistance zone, it could continue to move down. Initial support on the downside is near the $0.5045 level or the 76.4% Fib retracement level of the upward wave from the $0.4967 swing low to the $0.5293 high. The next major support is at $0.500.
The main support is now near $0.4965. If there is a downside break and a close below the $0.4965 level, the price might accelerate lower. In the stated case, the price could drop and test the $0.4840 support in the near term.
Technical Indicators
Hourly MACD – The MACD for XRP/USD is now gaining pace in the bearish zone.
Hourly RSI (Relative Strength Index) – The RSI for XRP/USD is now below the 50 level.
Major Support Levels – $0.5040 and $0.5000.
Major Resistance Levels – $0.5150 and $0.5200.


