An analyst has explained how XRP could end up targeting the $15 mark if this pattern is the governing one behind the latest price breakout.
XRP Was Trading Inside A Symmetrical Triangle Earlier
In a new post on X, analyst Ali Martinez has talked about where XRP could be heading next based on a technical analysis (TA) pattern. The pattern in question is a Symmetrical Triangle, which forms when an asset consolidates between two trendlines approaching each other at a roughly equal and opposite slope.
The top line of the triangle connects together successive lower highs in the price, and the bottom one higher lows. Like with other TA consolidation patterns, the former trendline is likely to provide resistance during a retest, while the latter one supports. A break out of either of these lines can imply a continuation of the trend in that direction. Naturally, an escape above the triangle is bullish, while a fall under it is bearish.
As the price consolidates inside a Symmetrical Triangle, its range gets narrower with time, until it shrinks to a point at the apex. Thus, as the asset travels toward the end of the triangle, it can become more likely to find a breakout.
The Symmetrical Triangle isn’t the only type of triangle that exists in TA. Two other popular variations are the Ascending and Descending Triangles, which emerge when one of the trendlines is parallel to the time-axis. As the names of these patterns already suggest, they involve consolidation toward a net upside and downside, respectively.
Now, here is the chart shared by the analyst that shows the Symmetrical Triangle that XRP was potentially trading inside for years before a breakout:
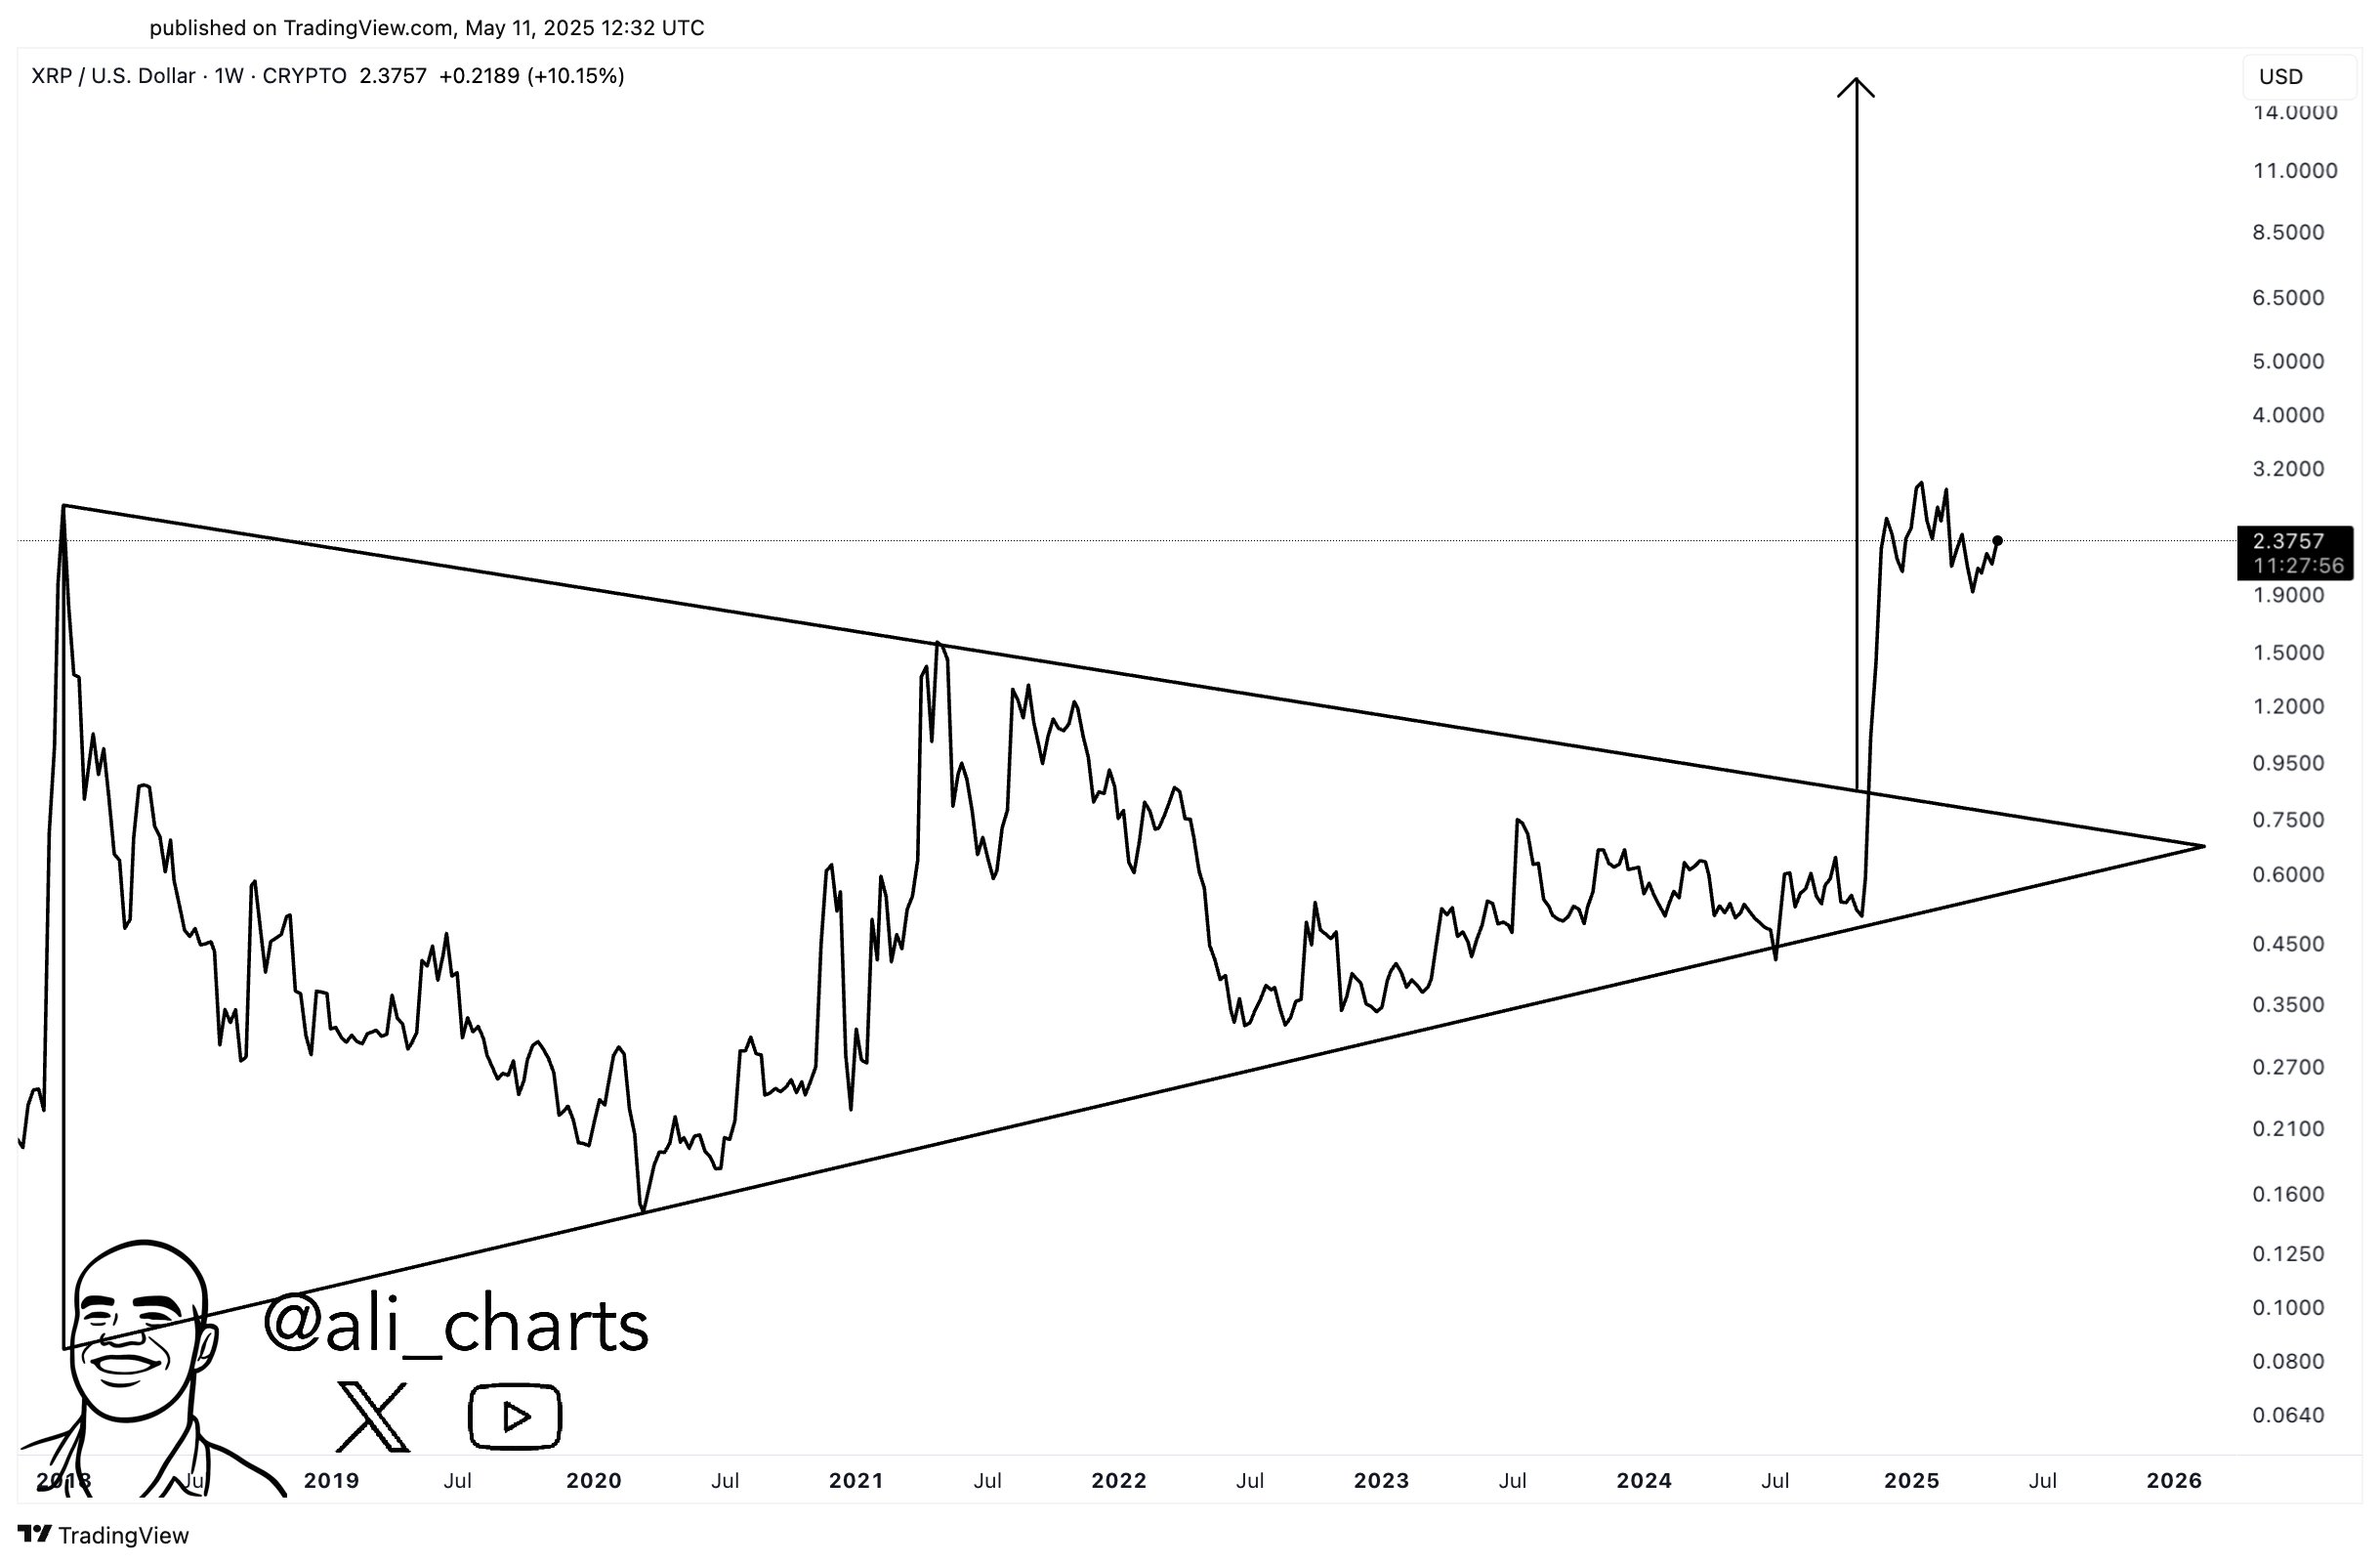
As displayed in the above graph, XRP was nearing the apex of this long-term Symmetrical Triangle last year, meaning a breakout was becoming probable. And indeed, with the bull rally during the last couple of months of the year, the coin managed to find a break above the pattern.
Generally, breakouts resulting from a triangular pattern are assumed to be of the same length as the height of the triangle itself. Based on the height of this Symmetrical Triangle, a potential bullish target could lie at around $15 for the cryptocurrency.
Naturally, this target would only hold if the trajectory that XRP is currently following is truly based on this Symmetrical Triangle. In the scenario that the pattern does end up being the governing one and the coin observes a bull run to this level, it would have seen an increase of more than 500% from the current price.
XRP Price
At the time of writing, XRP is floating around $2.45, up around 3% in the last seven days.


